Baby Head Size Analysis Diagram – Maximizing Customer Understanding
RJ0700007_28
- Last Update 07/23/2025
- File Size 0.3MB
- # of Slides 2
- File Format PPTX
- Slide Ratio 16:9
- Color
Keywords
About the Product
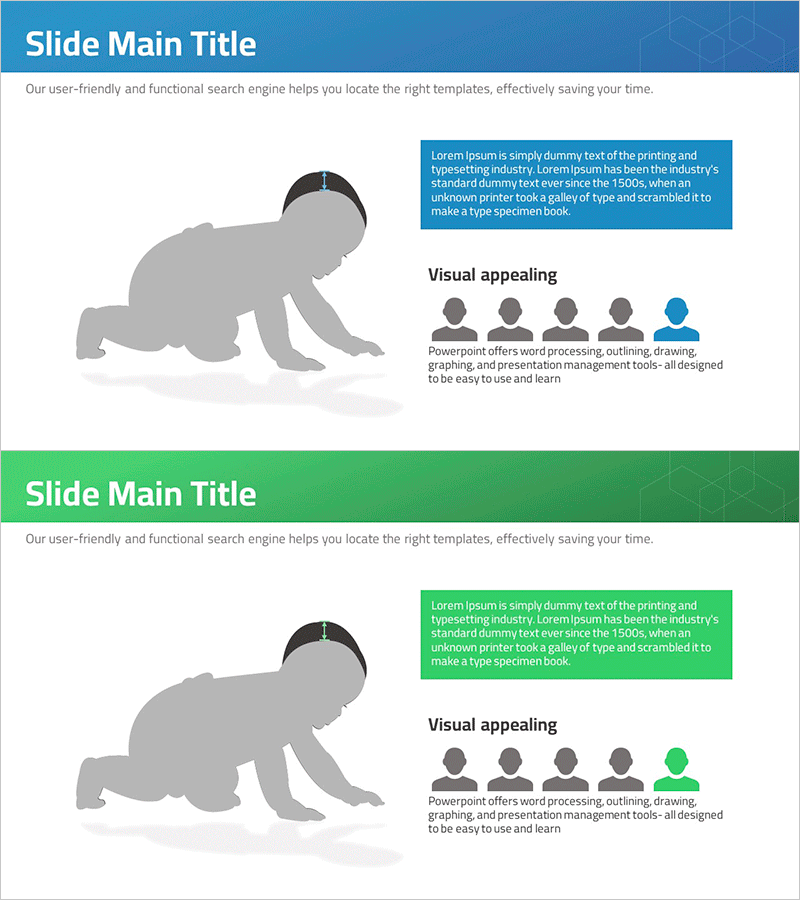
A 2-slide PowerPoint presentation designed for customer understanding and market analysis. The layout features a blue header with white background for clear visual contrast, combining left-side illustration and right-side text box in a balanced 2-column structure. Each slide includes title area, descriptive text box, and step-by-step icon elements to effectively present customer segments, market research findings, and target analysis. This PPT design is ready to use in presentations, business reports, and pitch decks for immediate deployment.
Usage Points
-
Main Usage
Visually communicate customer segments, target markets, and market research findings. The 2-column structure with left illustration and right text box allows simultaneous presentation of imagery and data, enhancing audience comprehension and engagement.
-
How to Use
Place customer-related images or icons in the left illustration area and input analysis content, statistics, and insights in the right text box. Add section titles to the blue header to clarify document structure, and use icon elements to represent step-by-step information or progression.
-
Recommended For
Ideal for marketing plans, business proposals, investor pitch decks, and market analysis reports. Suitable for new business planning, product development strategy, and customer segmentation presentations. Commonly used by marketing teams, strategy departments, and executive presentations.
-
Slide Structure
2-slide set with each slide featuring a blue header (title area), left illustration space, right text box (description and details), and bottom icon elements (5-step progression). Optimized for 16:9 widescreen format in modern presentation environments.
Related Products
-

Mixed Charts and Customer Analysis – Visualizing Customer Insights
#Market and Competitor Analysis #Financial Plans and Performance #Graph
-

User Analysis Pictogram Graph – Visualizing Customer Success
#Market and Competitor Analysis #Customer Success Stories #Graph
-

Piano Icon Graph Slide – Data Visualization for Customer Analysis
#Market and Competitor Analysis #Graph #Other
-

Horizontal Bar Charts for Customer Analysis – Summer Vacation Template
#Market and Competitor Analysis #Graph #Other
