Science Experiment Analysis Circle Graph – Market and Service Introduction
RJ0700007_6
- Last Update 07/23/2025
- File Size 7.4MB
- # of Slides 2
- File Format PPTX
- Slide Ratio 16:9
- Color
Keywords
- #Content-Based Slides
- #Design-Based Slides
- #Product/Service Introduction
- #Market and Competitor Analysis
- #Graph
- #Composition
- #Market Analysis
- #Circles
- #Doughnut Chart
- #16:9
- #donut chart PowerPoint
- #pie chart slide template
- #ratio visualization presentation
- #market analysis chart PPT
- #4-segment donut diagram
- #circular graph slides download
About the Product
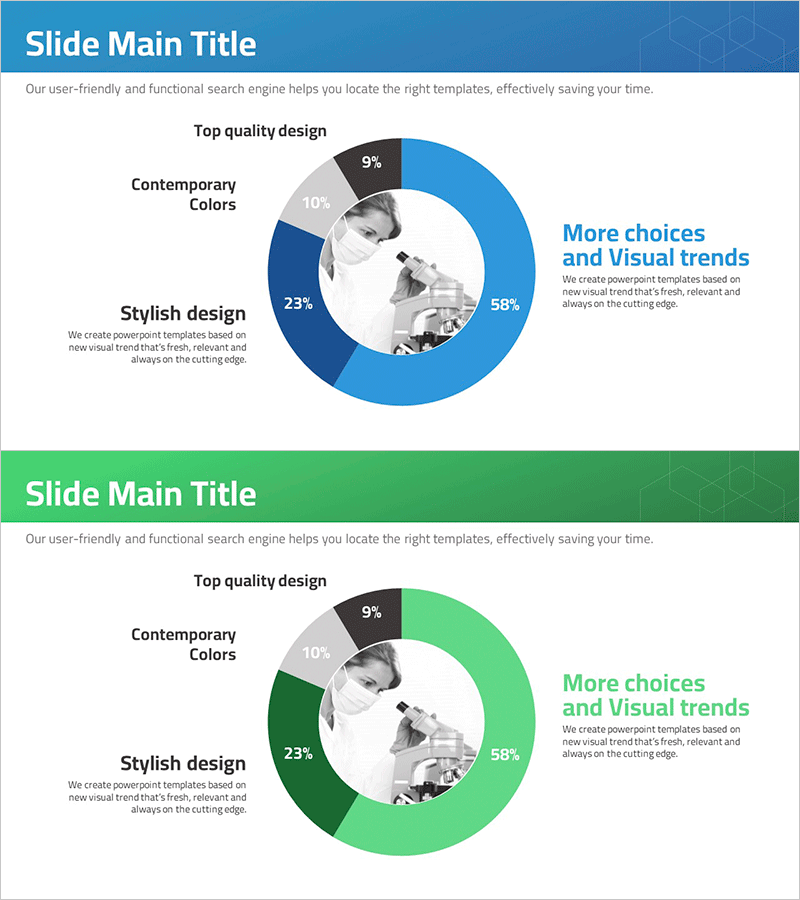
A donut-shaped pie chart PowerPoint slide optimized for market analysis and service introduction presentations. The design features four data segments in bright blue, navy, gray, and black colors that intuitively represent proportional relationships. A central image insertion area enhances visual impact, while dedicated text zones below each segment allow for detailed explanations. This 2-slide template is formatted in 16:9 widescreen ratio for seamless compatibility with modern displays. Perfect for market research, product portfolio presentations, scientific analysis, and business reports requiring clear ratio visualization.
Usage Points
-
Main Usage
Clearly visualize data composition and distribution using a donut-shaped pie chart format. Ideal for representing market share, customer segmentation, product category proportions, budget allocation, and part-to-whole relationships. The central image area emphasizes key messages or brand logos effectively.
-
How to Use
Modify each segment's percentage values and labels to match your data. Insert relevant photos or icons in the central image area. Maintain the existing blue and navy color scheme or customize with your brand colors. Complete the presentation by adding descriptive text and numerical data in the designated text zones.
-
Recommended For
Marketing professionals, data analysts, business executives, product managers, academic presenters, and consultants explaining market analysis, customer insights, financial status, project progress, and scientific experiment results. Suitable for survey data visualization and competitive analysis presentations.
-
Slide Structure
2-slide template featuring a centered donut pie chart with 4 data segments. Central image insertion area for visual emphasis. Left and right text boxes positioned for segment descriptions and data interpretation. Formatted in 16:9 widescreen ratio optimized for contemporary projectors and digital displays.
Related Products
-

Oriental Medicine Component Circle Graph – Accurate Visualization of Market and Products
#Product/Service Introduction #Market and Competitor Analysis #Graph
-

Comparative Analysis of Composition Contents Pie Chart – Market and Competitor Analysis
#Product/Service Introduction #Market and Competitor Analysis #Graph
-

Aerospace Industry Technology Status Graph – Market Dominance Data Analysis
#Product/Service Introduction #Market and Competitor Analysis #Graph
-

Security Business Composition Pie Chart – Market and Competitor Analysis
#Product/Service Introduction #Market and Competitor Analysis #Graph
