주메뉴 바로가기 본문으로 바로가기
Divorce PPT Wide Template – Emotionally Engaging Design

Divorce PPT Wide Template – Emotionally Engaging Design

J0600076

  • Last Update 01/10/2025
  • File Size 13.3MB
  • # of Slides 36
  • File Format PPTX
  • Slide Ratio 16:9
  • Color

About the Product

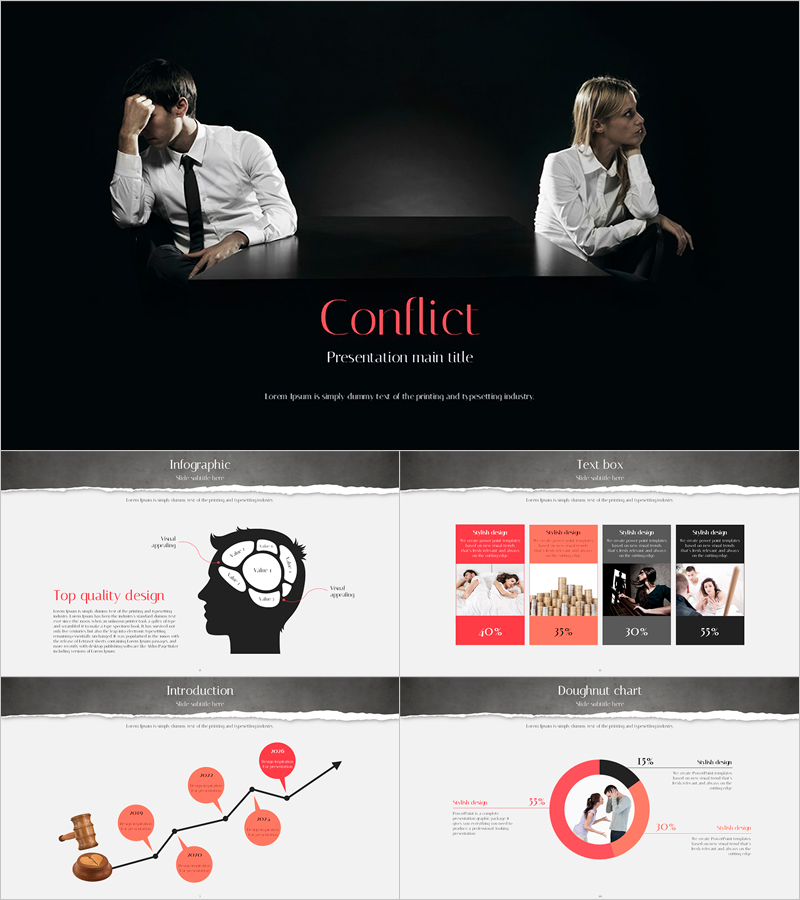
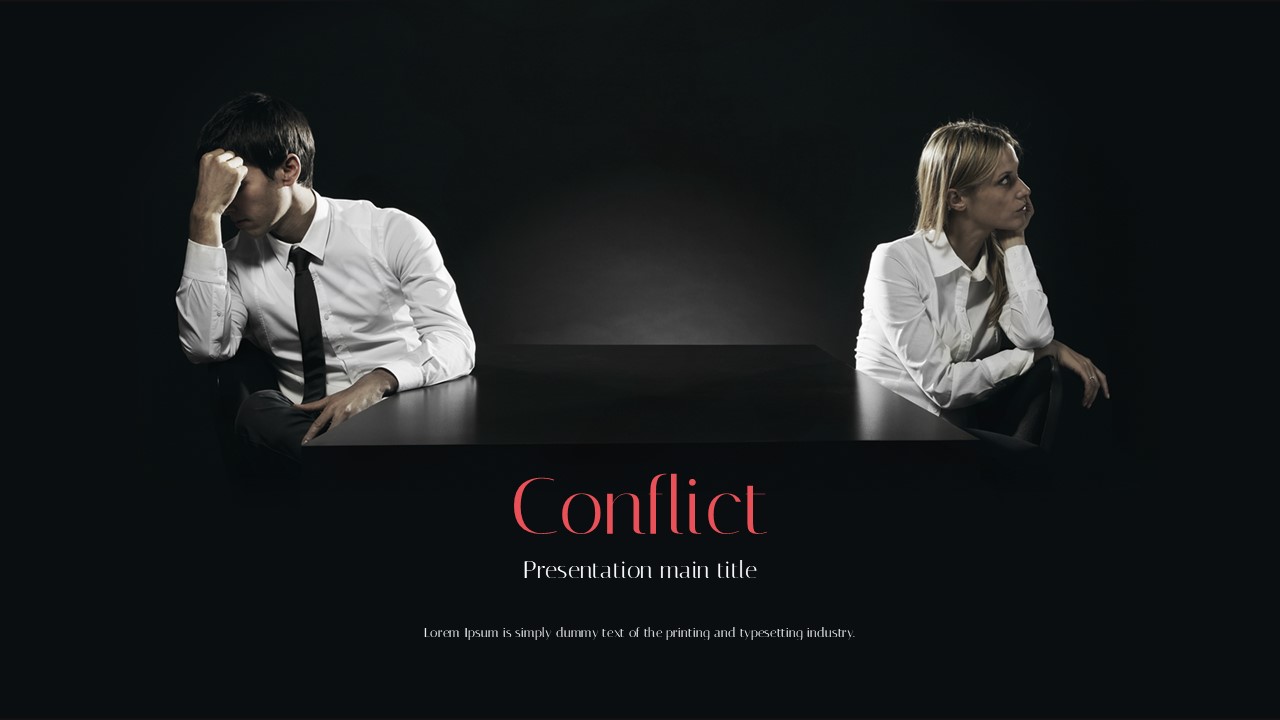
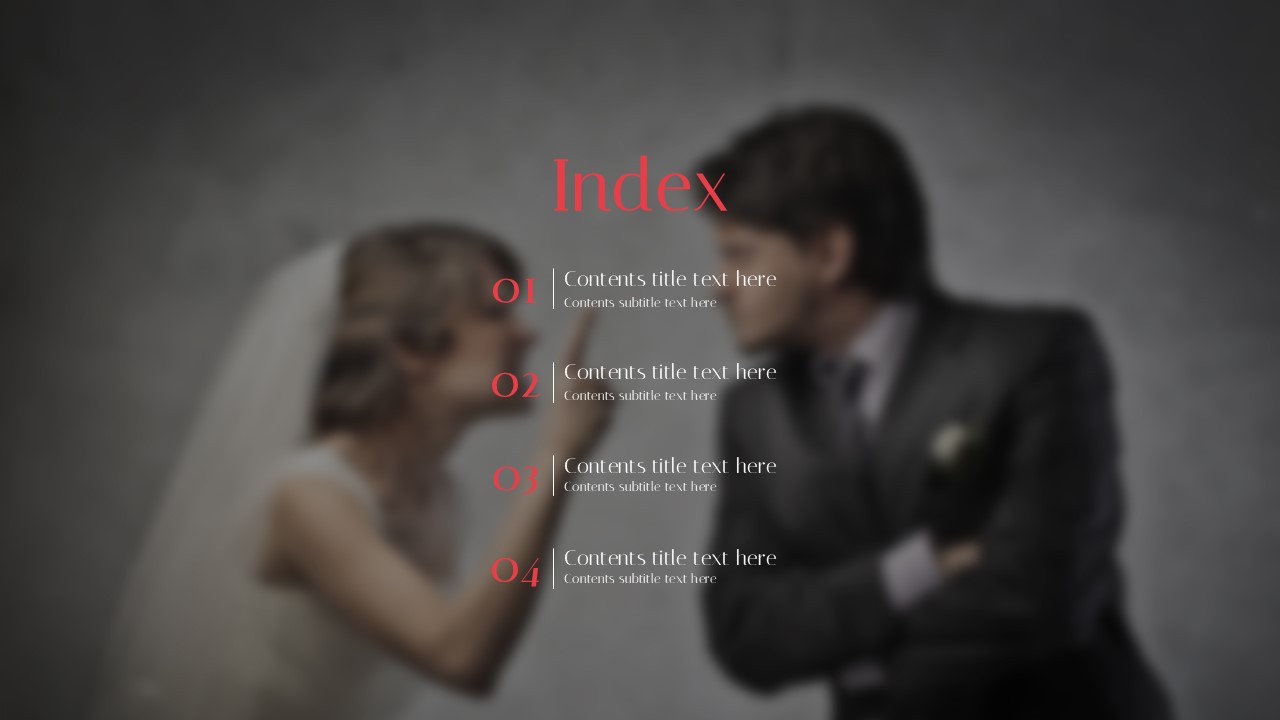
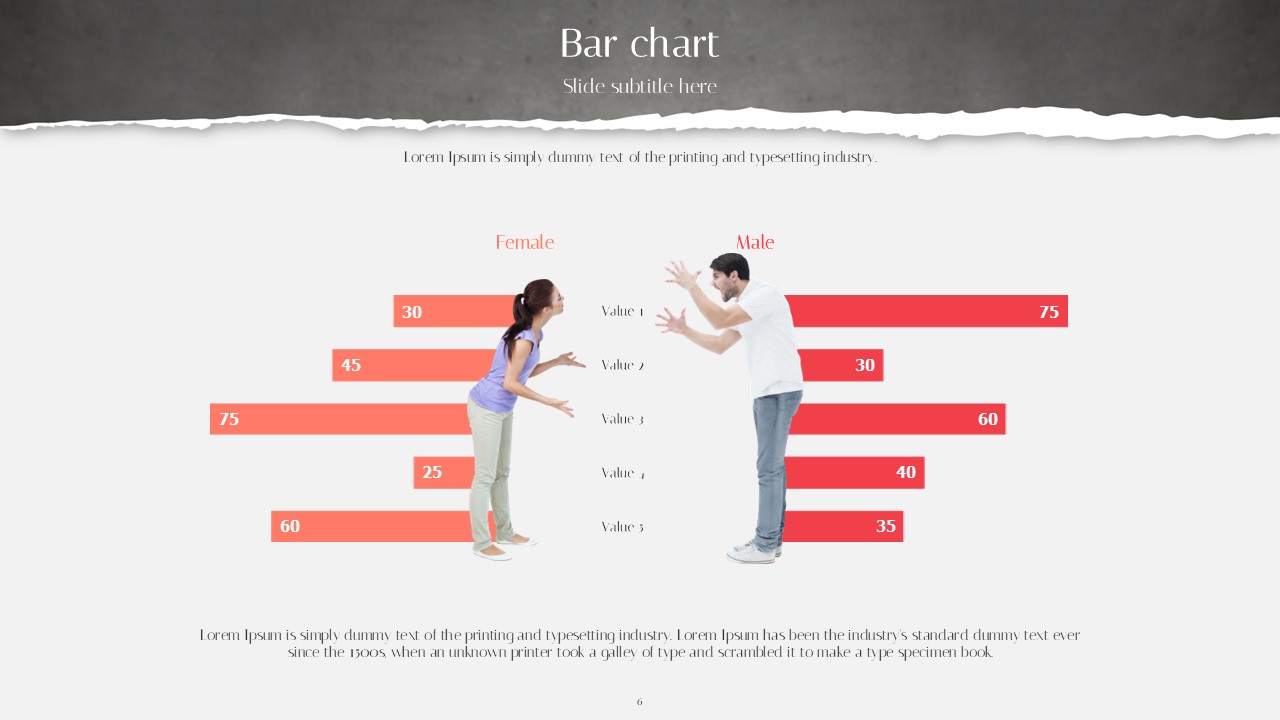
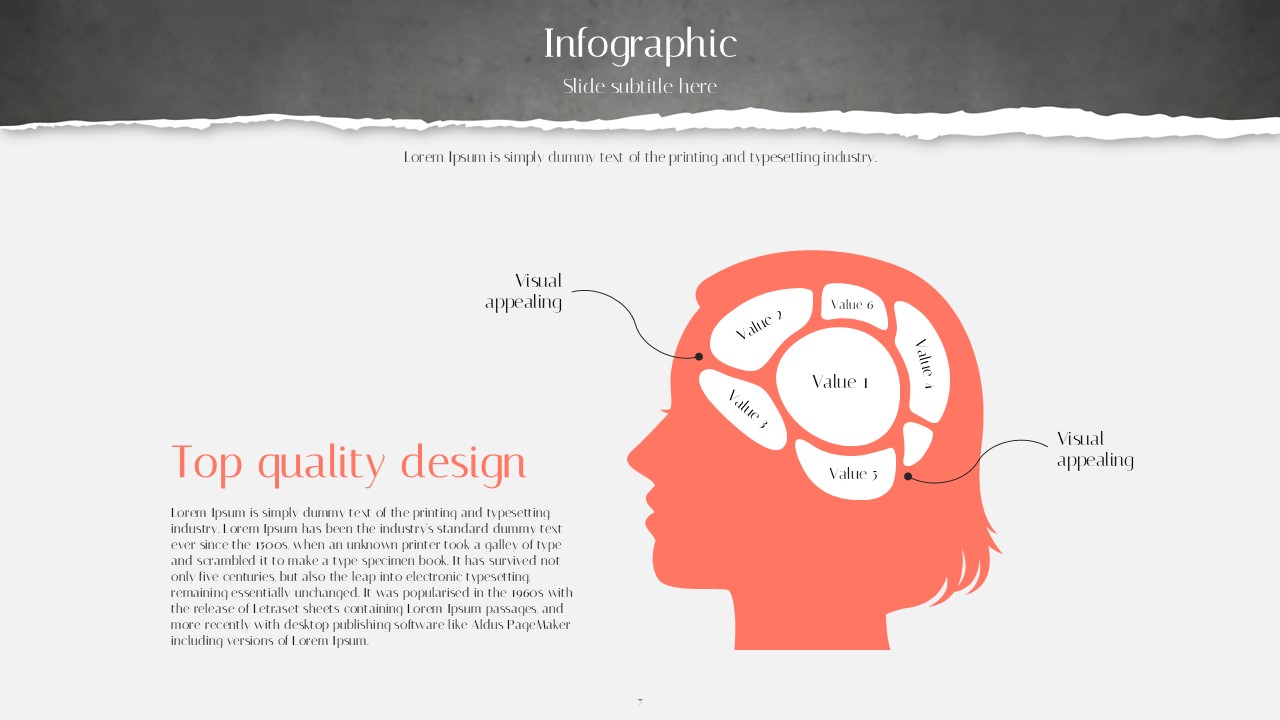
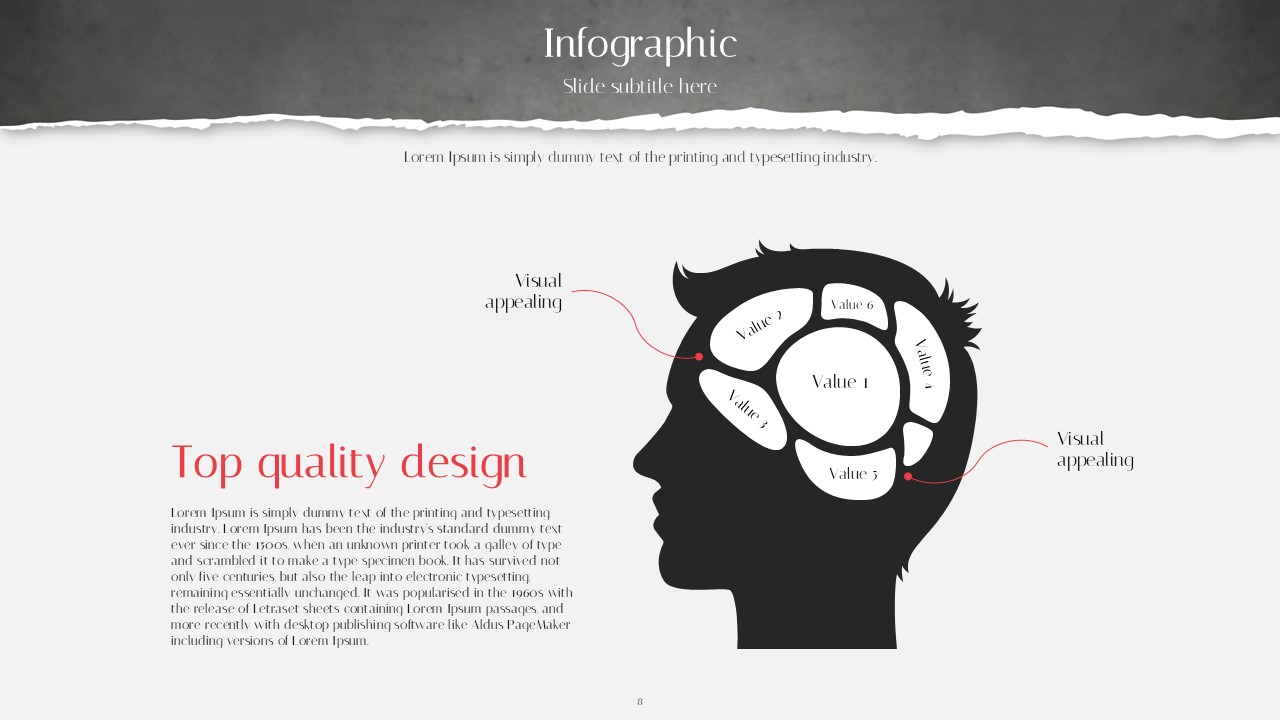
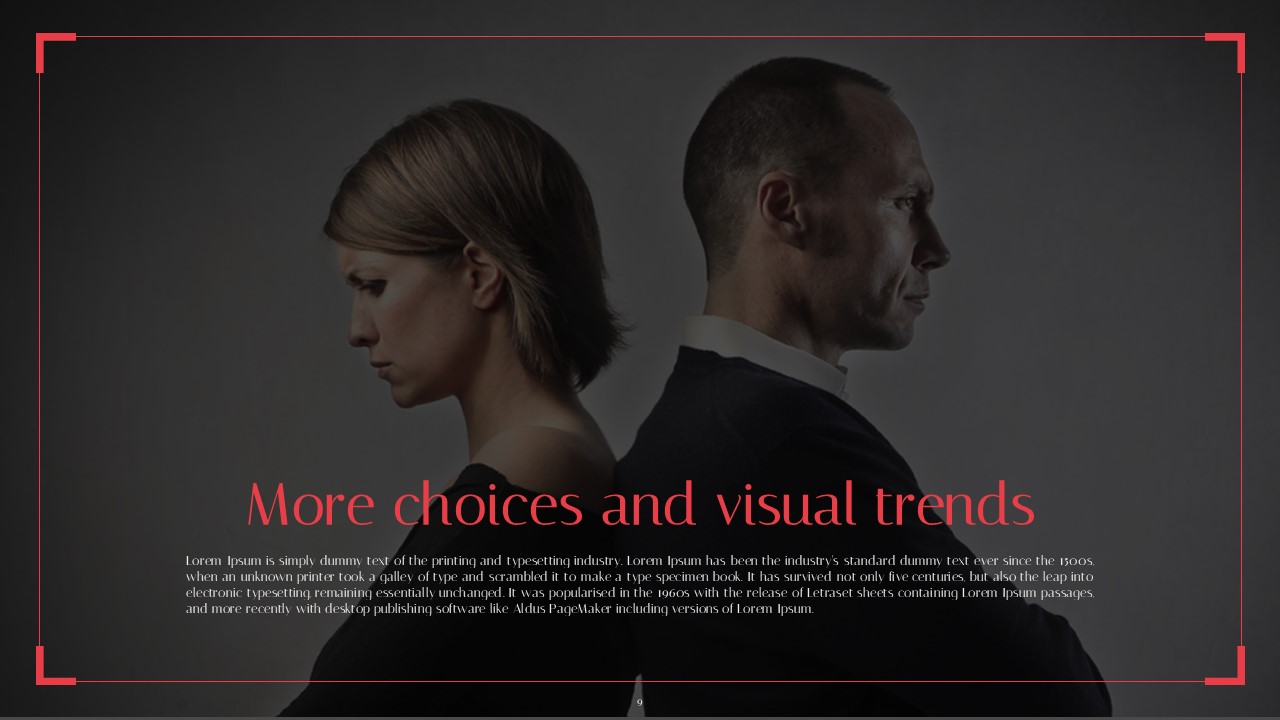
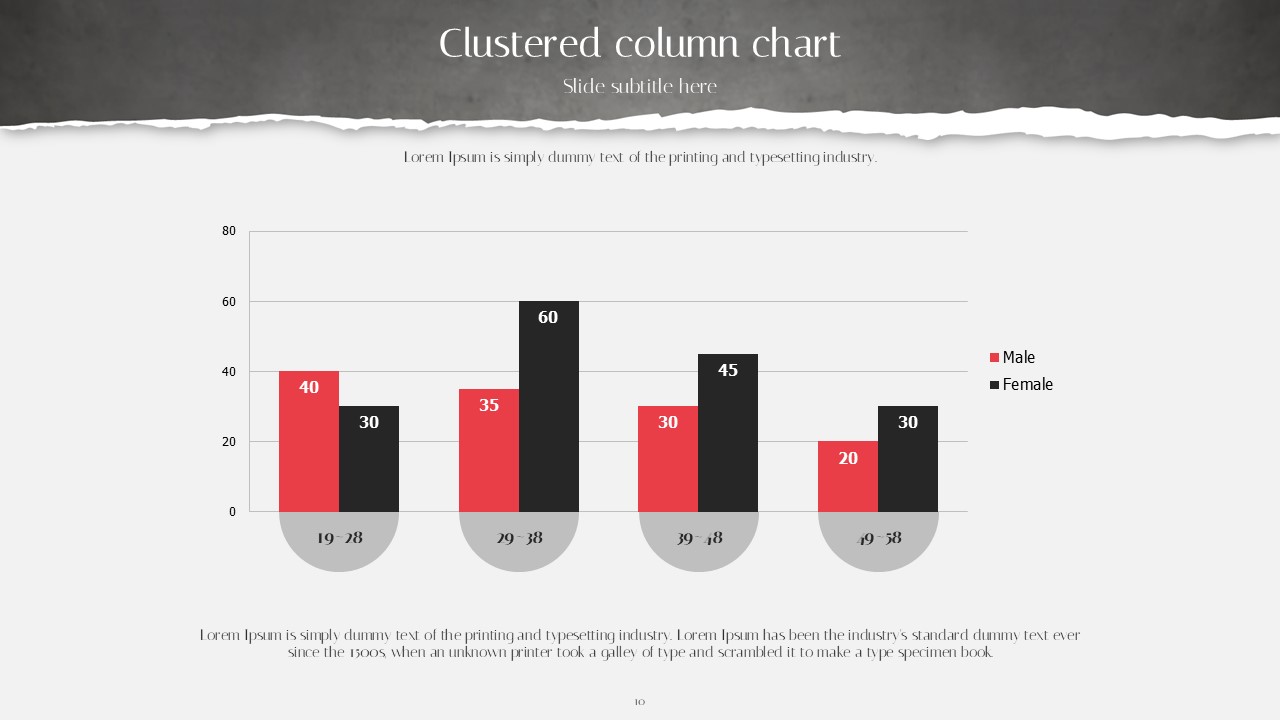
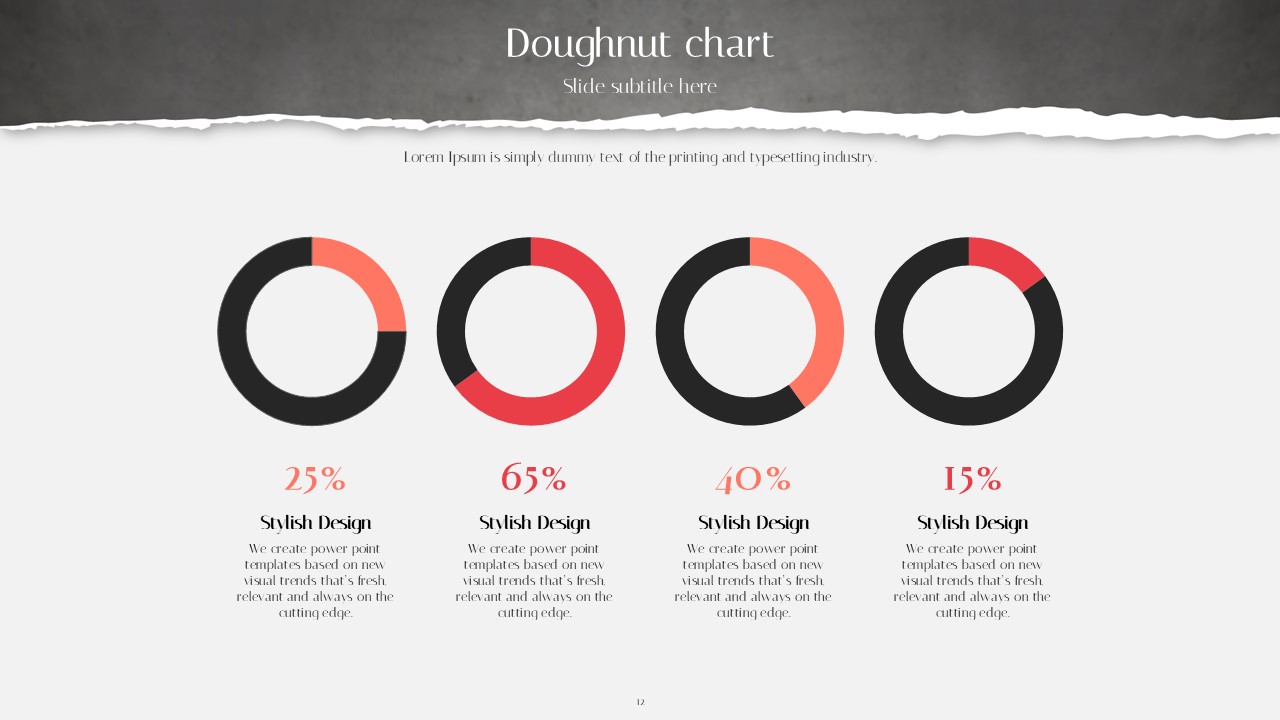
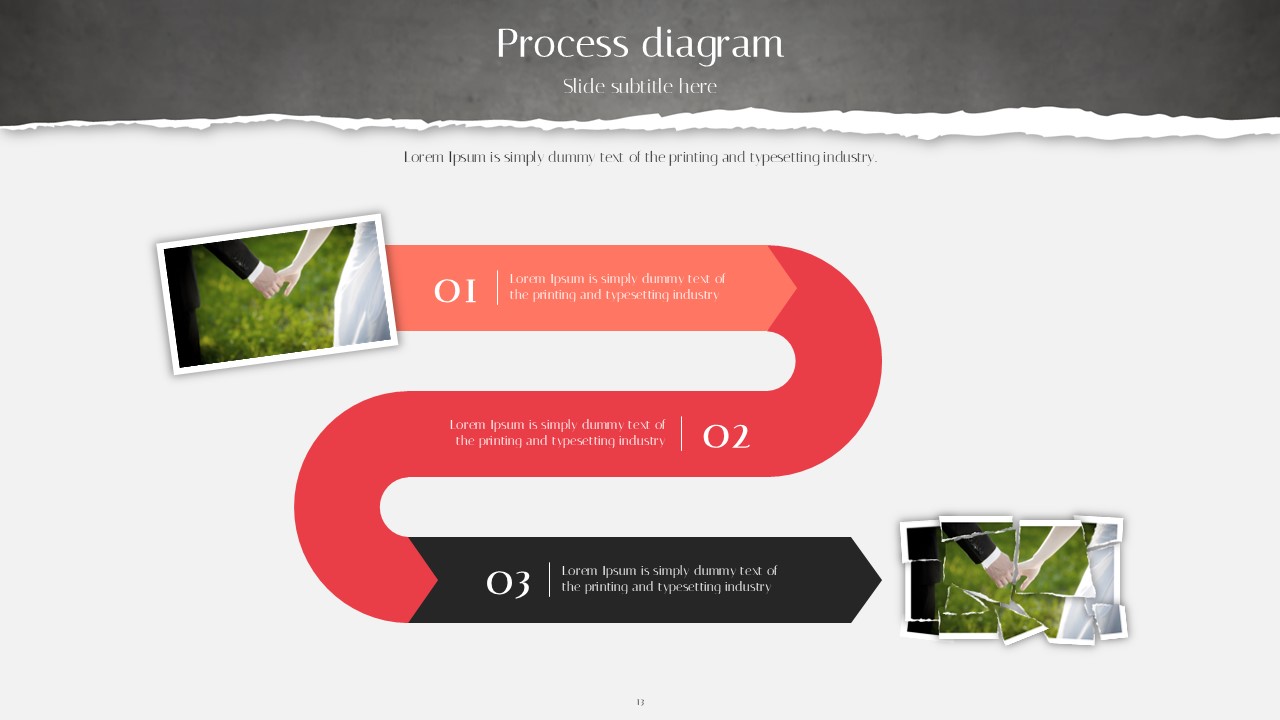
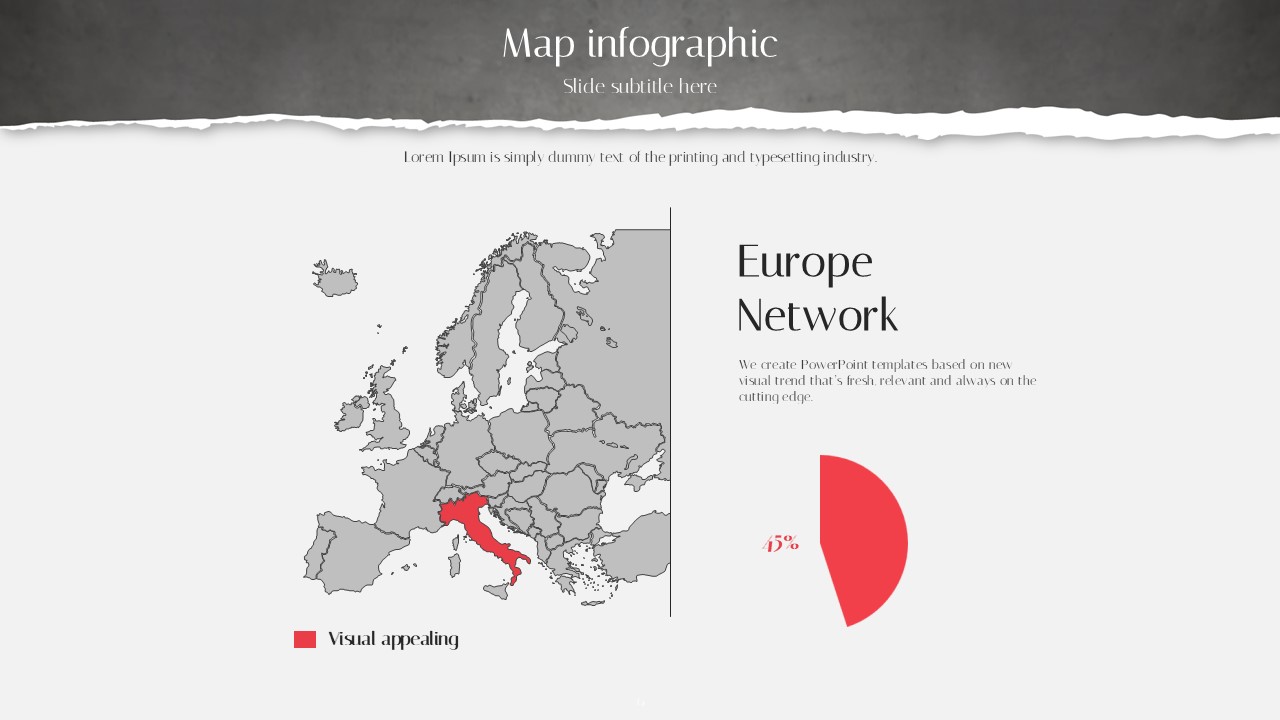
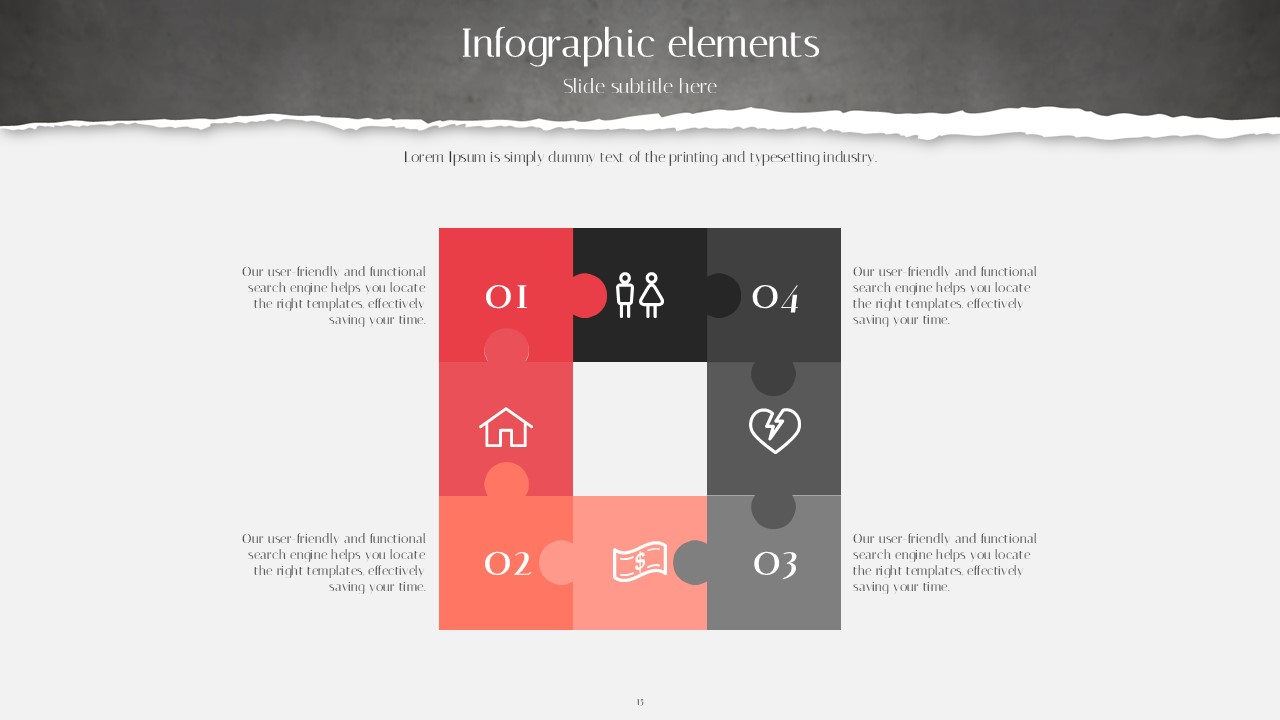
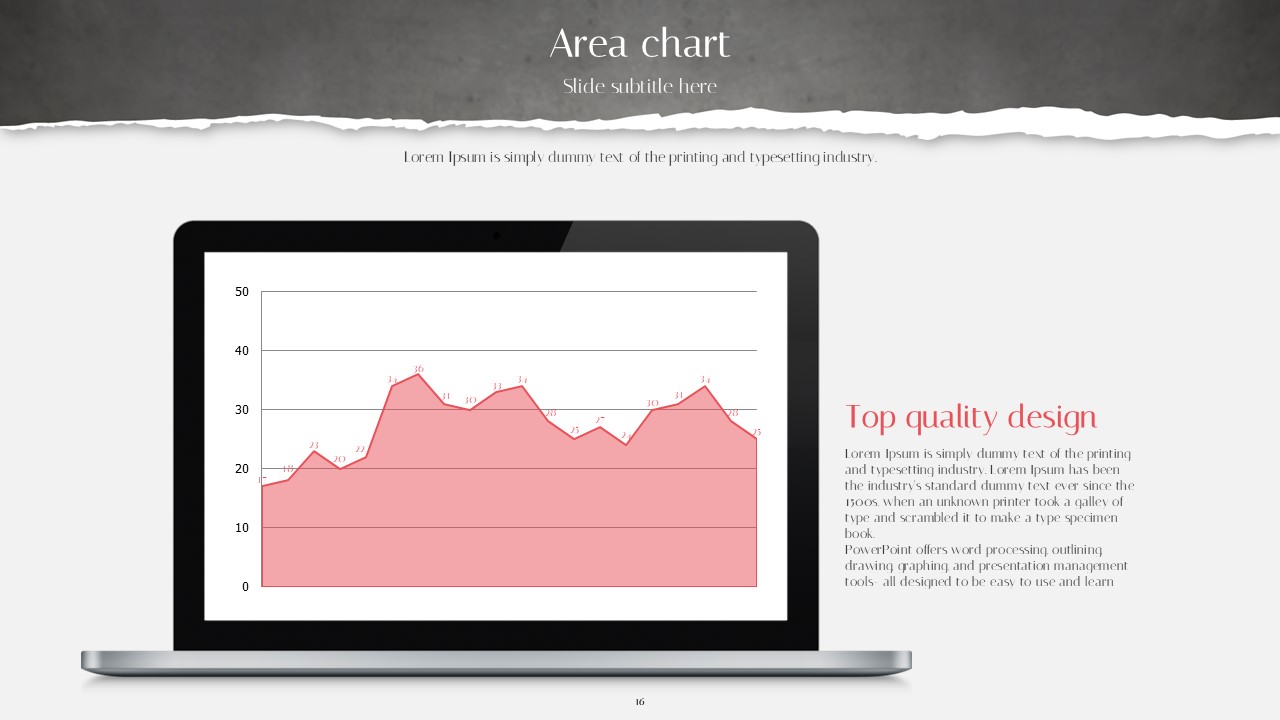
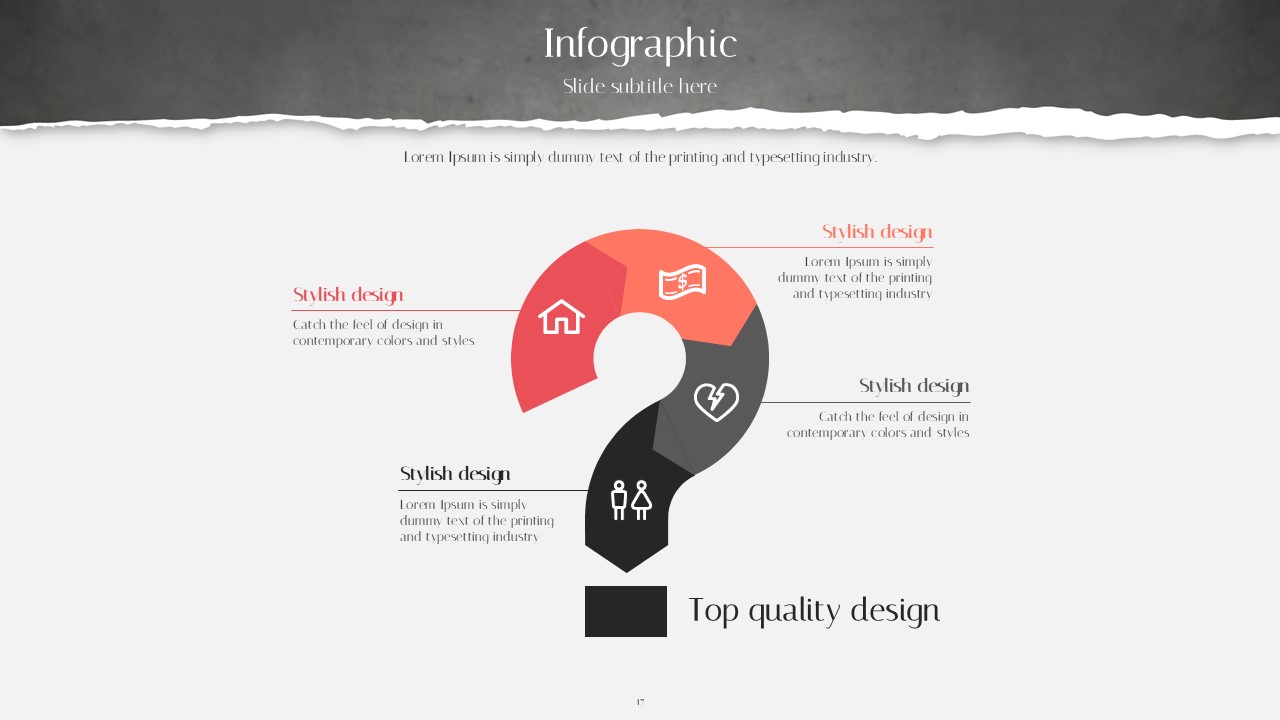
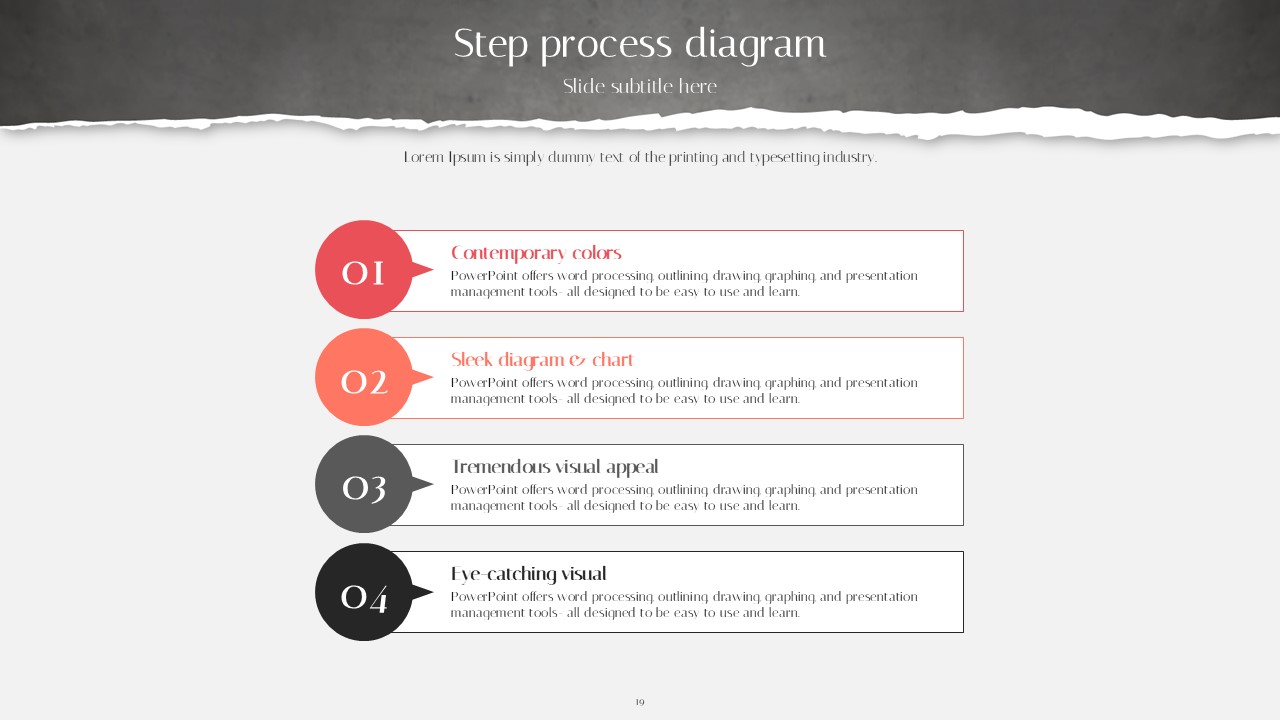
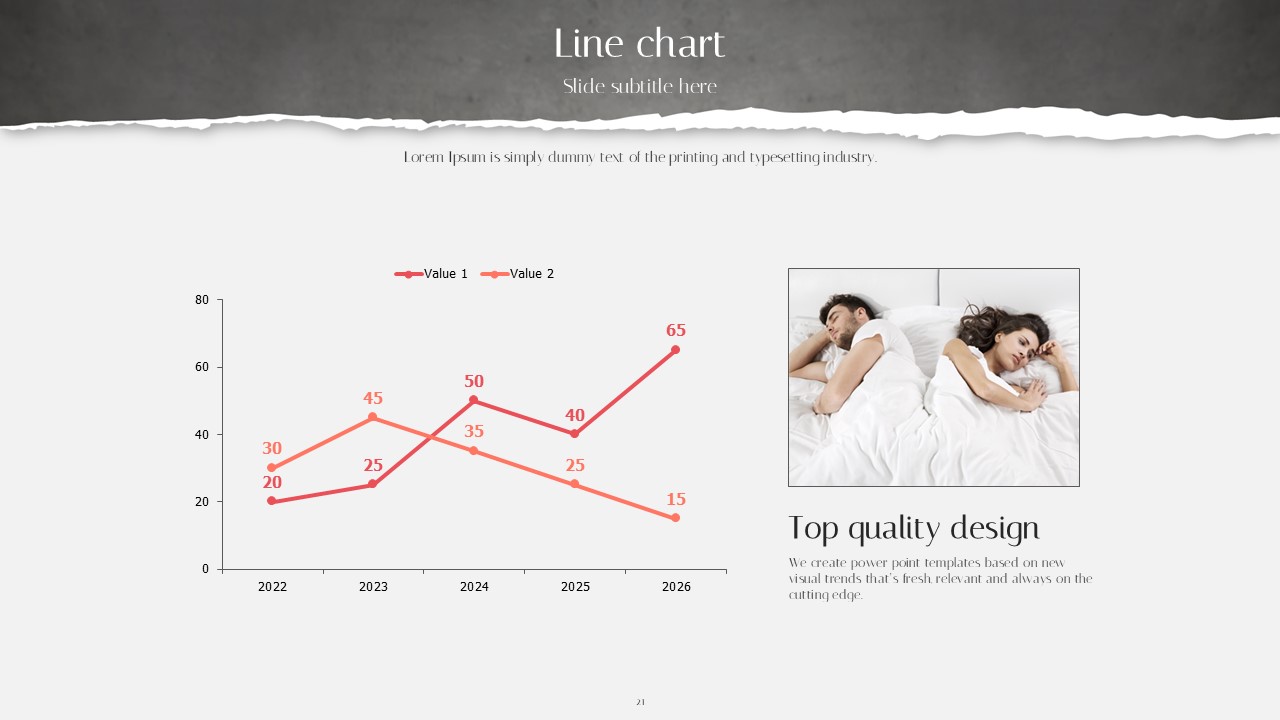
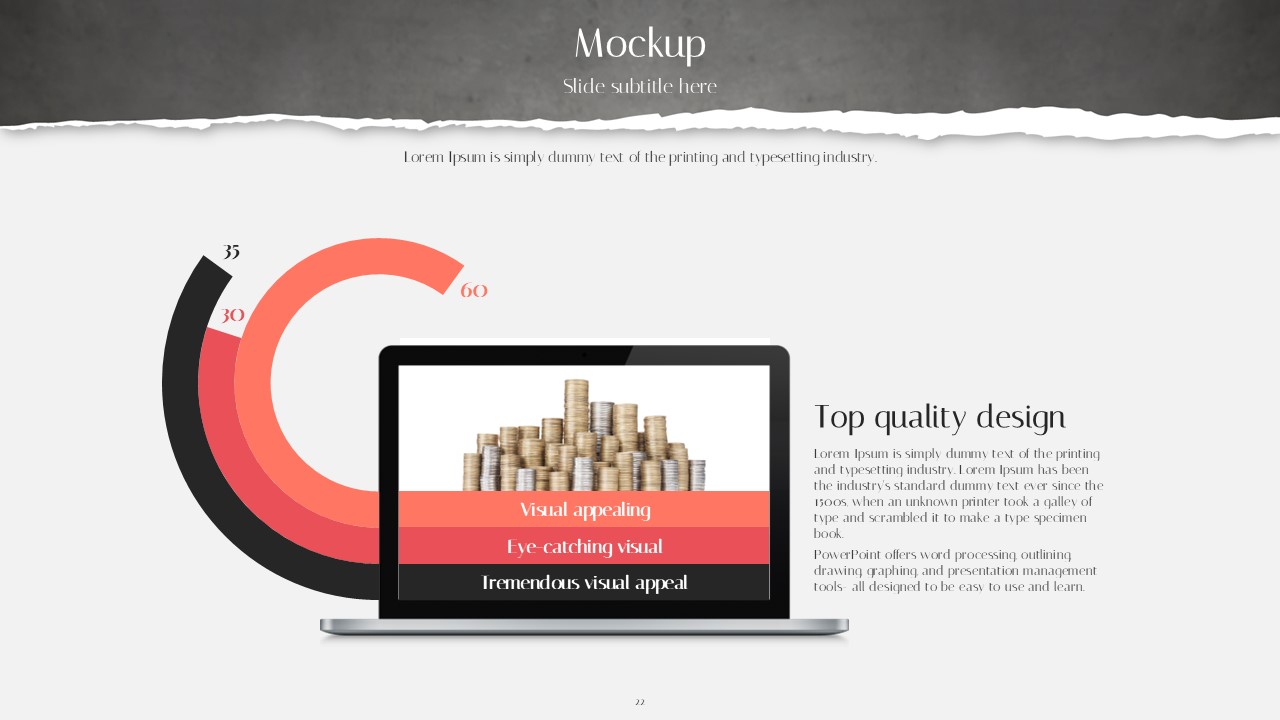
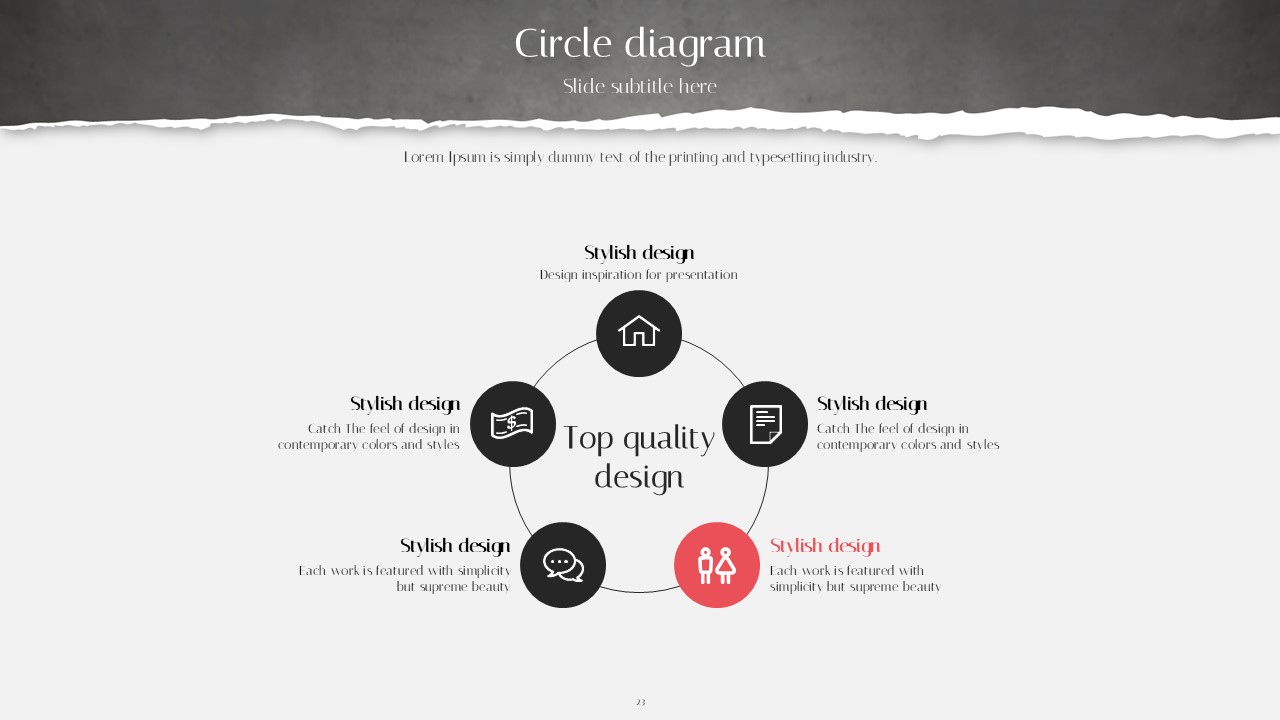
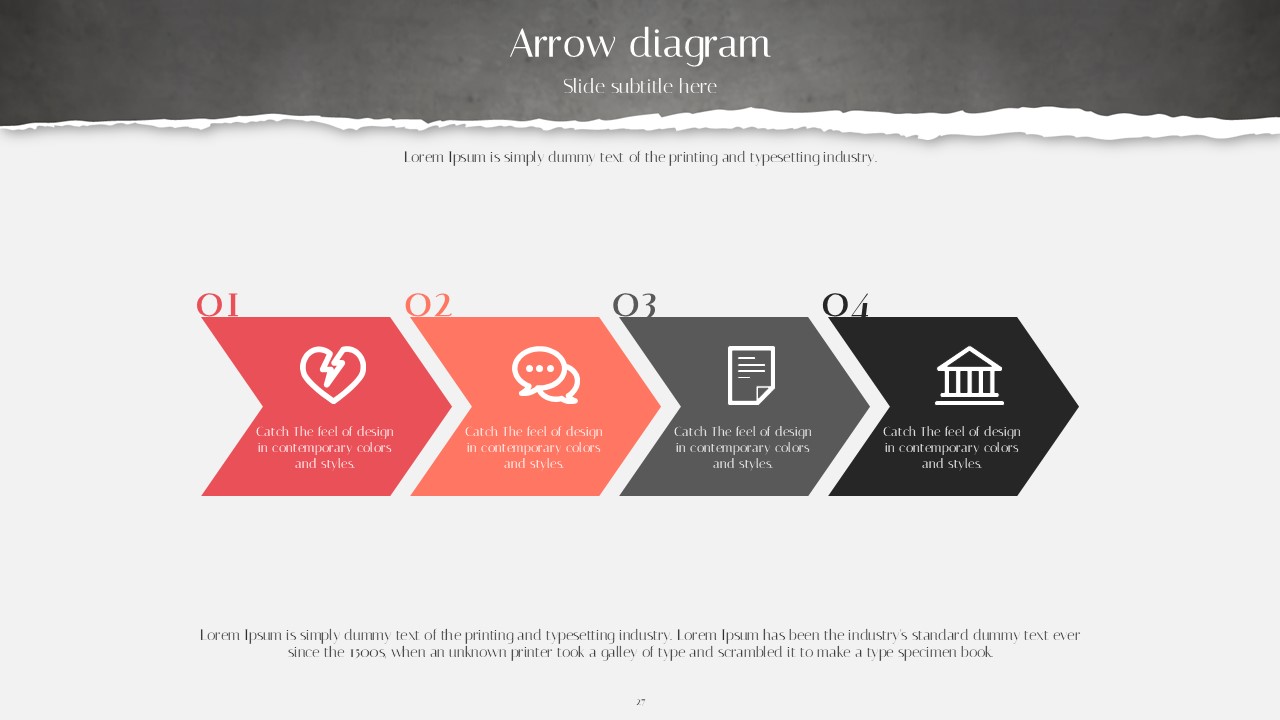
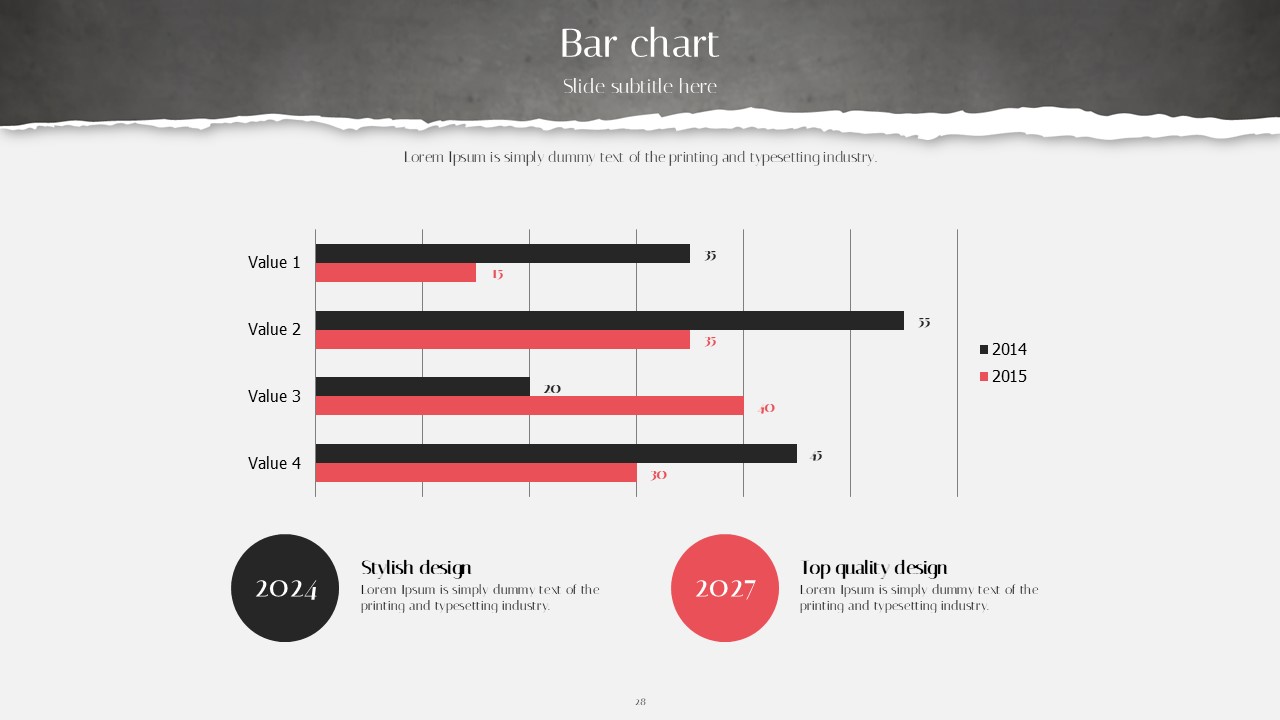
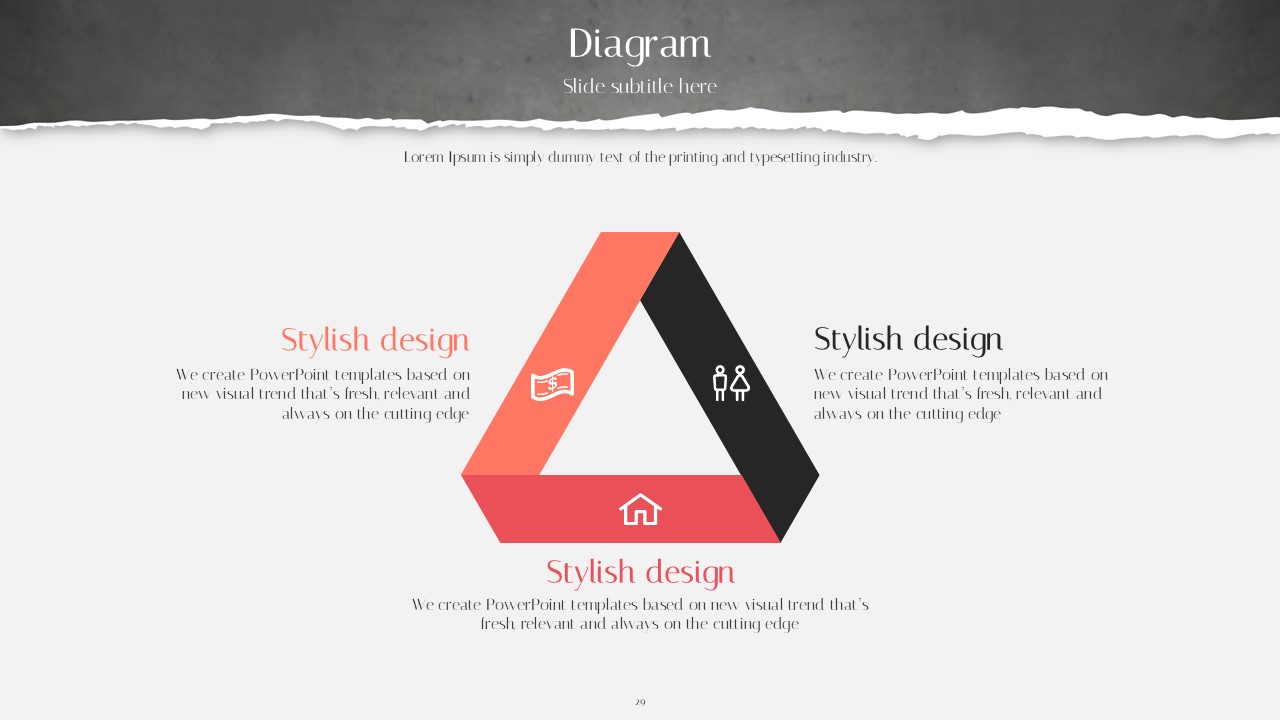
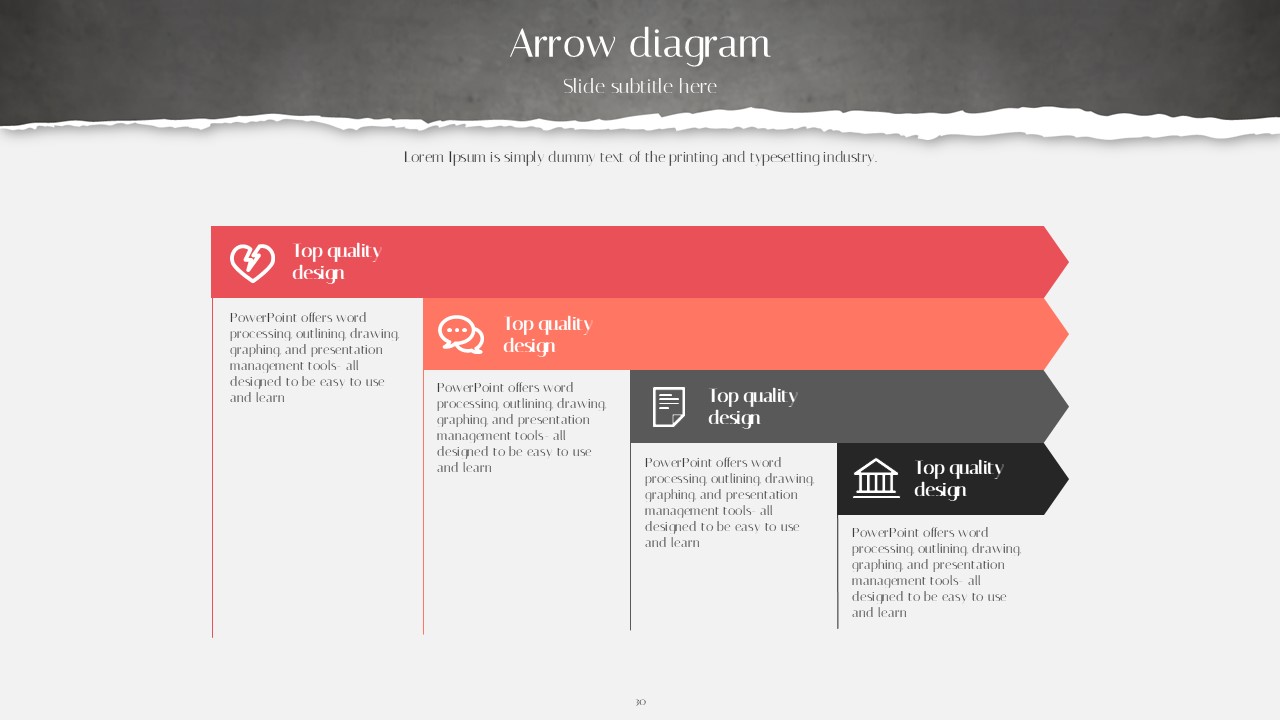
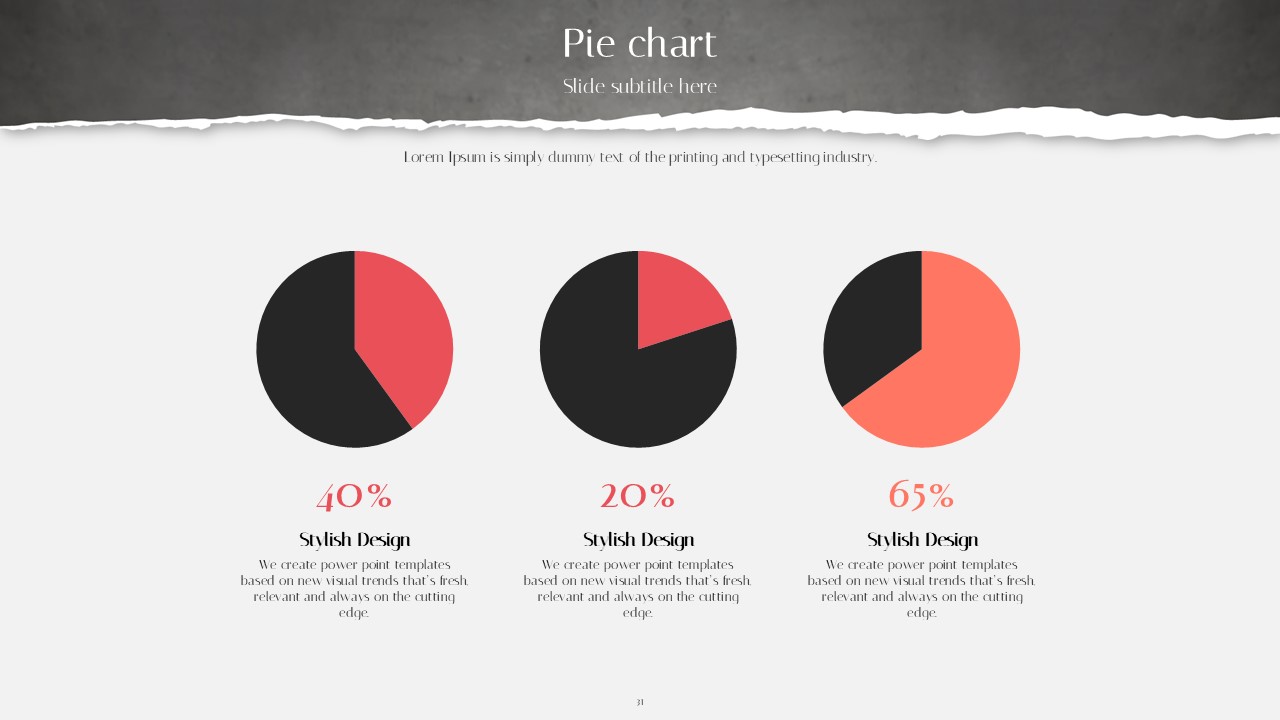
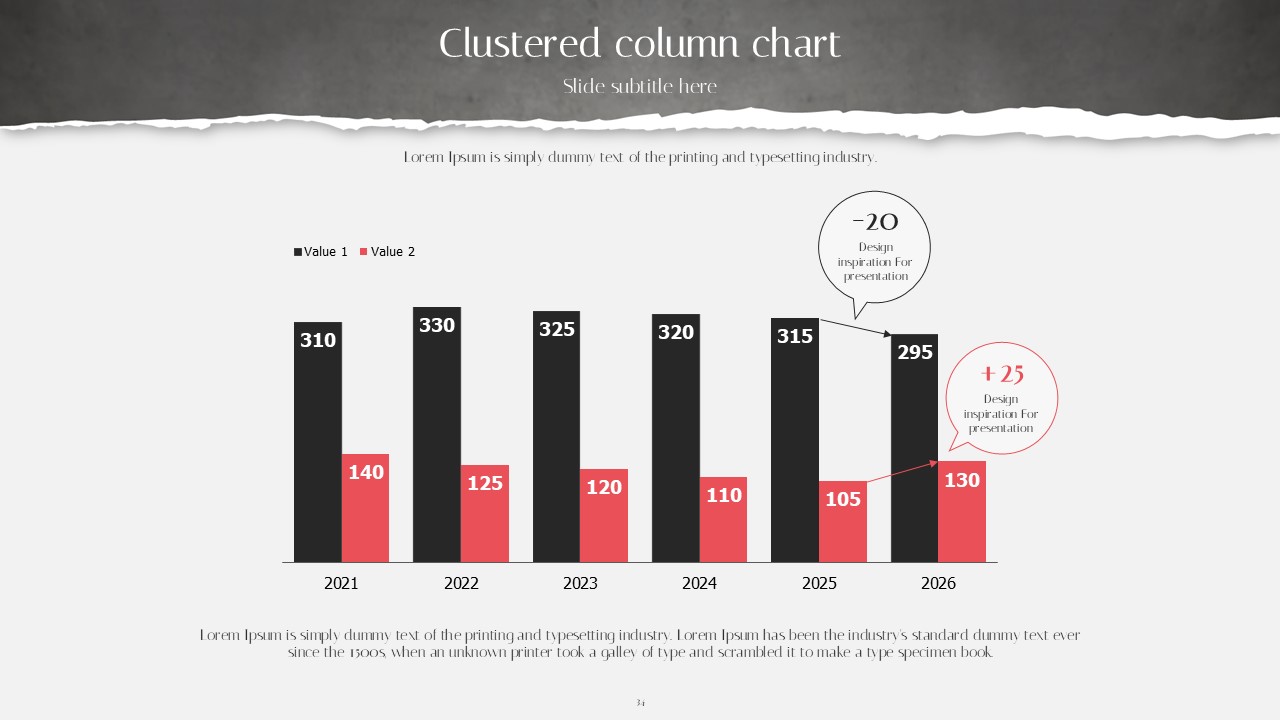
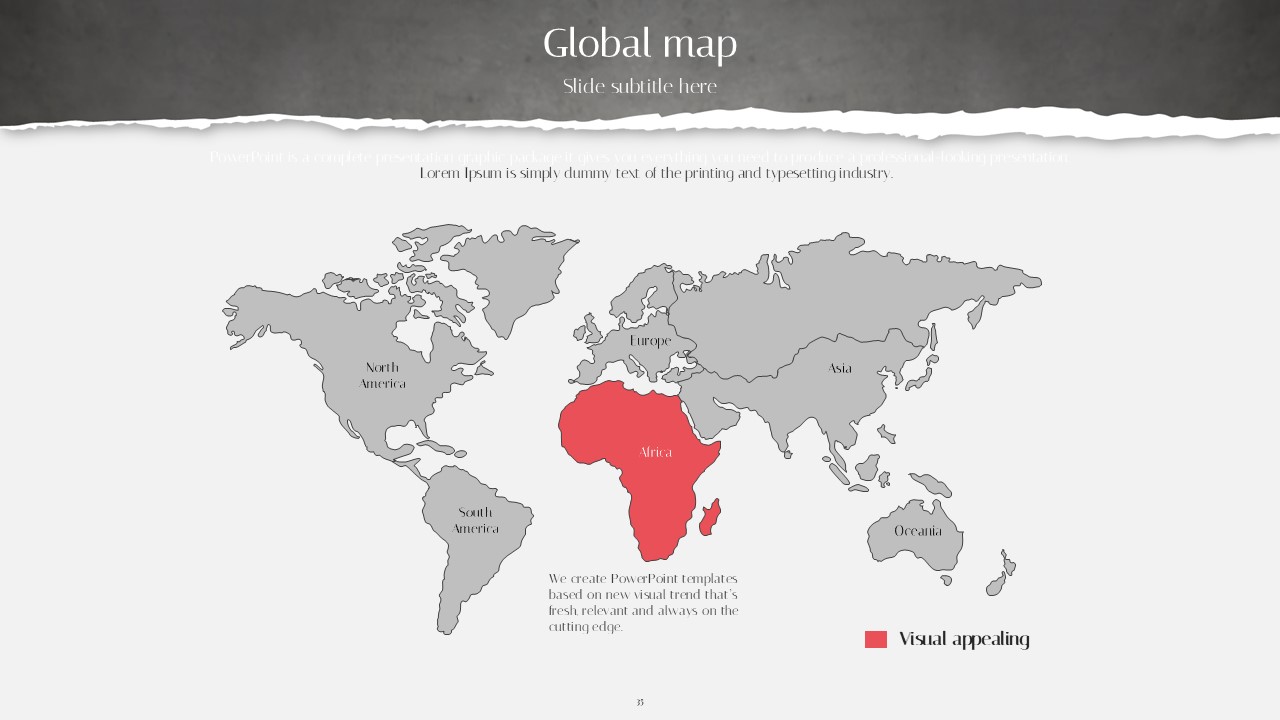
A dramatic dark-toned PowerPoint template combining black and charcoal gray backgrounds with red and coral accent colors. The design features torn-paper texture headers and emotionally resonant photo layouts, making it ideal for presentations on conflict, negotiation, psychology, and social issues where emotional storytelling matters. This 36-slide deck includes a wide variety of slide types: cover slide with full-bleed portrait photography, brain silhouette infographic, four-panel image text box, timeline introduction, donut chart, area chart with laptop mockup, clustered column chart (2021–2026 data), and line chart with photo pairing. The balanced two-column grid layout allows clean distribution of text, images, and data across every slide. Delivered in fully editable PPTX format, this presentation template is ready to customize for legal, counseling, social welfare, psychology, and data-driven storytelling presentations.

Usage Points

  • Main Usage

    Designed for presentations on emotionally charged topics such as conflict, negotiation, psychology, and social issues. The dark dramatic tone with red accents conveys seriousness and impact, making it well-suited for legal, counseling, and social welfare contexts.

  • How to Use

    Open the PPTX file and replace placeholder text, photos, and chart data with your own content. The torn-paper texture headers and two-column grid layout are fully editable, allowing you to adjust accent colors to match your brand or organization's visual identity.

  • Recommended For

    Legal professionals, counselors, psychologists, social workers, researchers, and consultants who need to present sensitive or data-driven topics with both analytical clarity and emotional resonance. Also suitable for educators and trainers covering conflict management.

  • Slide Structure

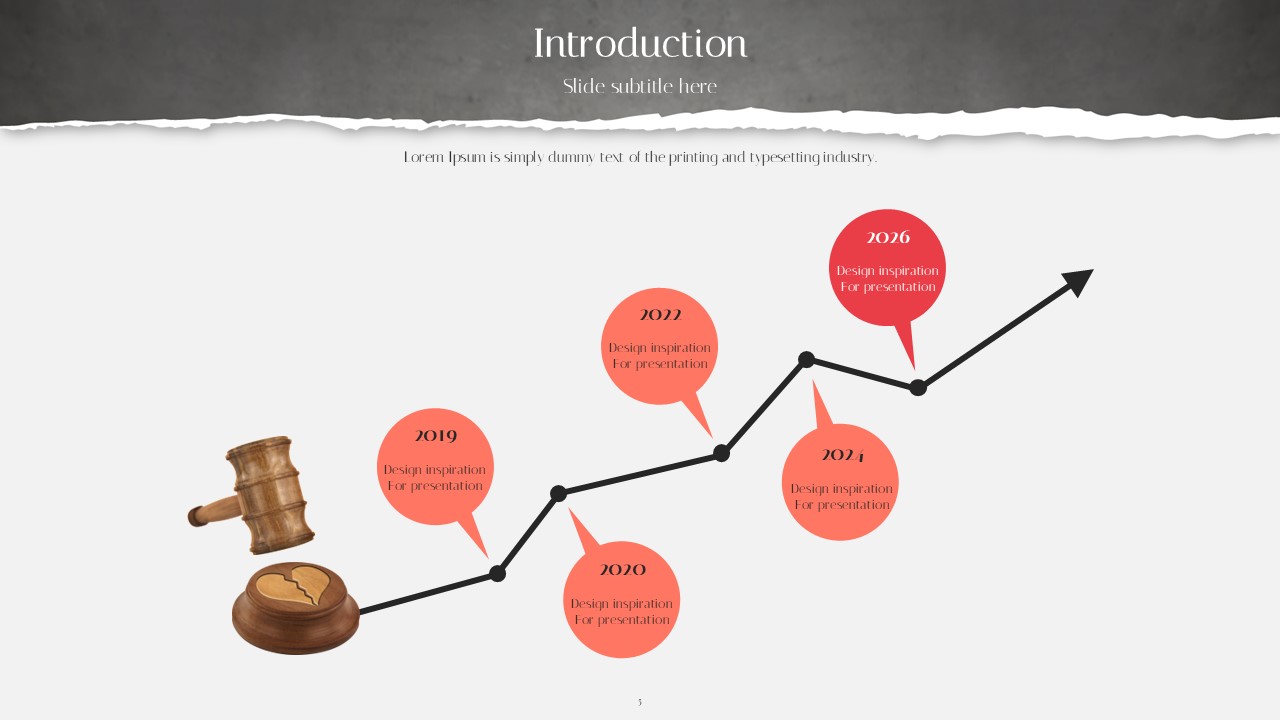
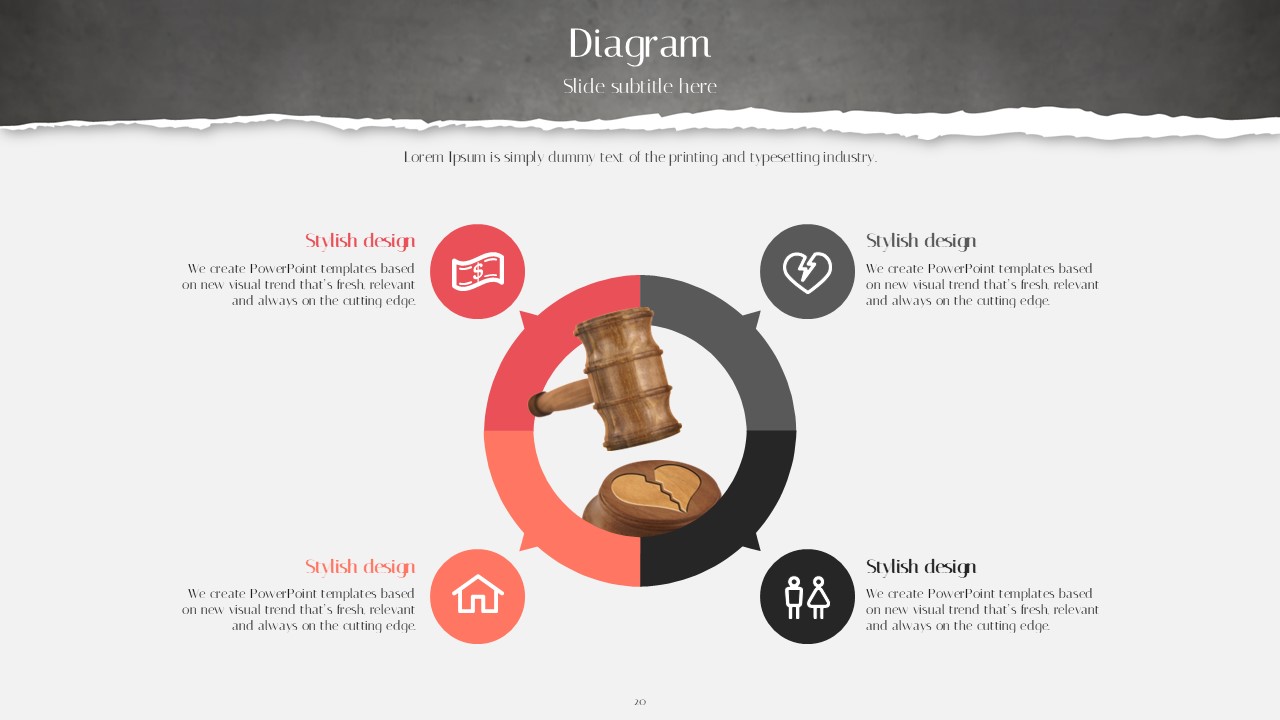
    36 slides total: black background portrait cover, brain silhouette infographic, four-panel image text box with percentages, arrow timeline introduction with gavel image, donut chart with photo, area chart on laptop mockup, clustered column chart (2021–2026), and two-line trend chart with photo pairing.

View Individual Slides in This Template

- Marital Conflict Template Cover – Emotion and Understanding

- Analysis of Causes of Marital Conflict – Case Study Focus

- Red Purple Donut Chart – Visualized Data

- Divorce Process Diagram – Business Operation Strategy

- European Network Presentation Template – Market and Competitor Analysis

- Causes of Domestic Discord Diagram – Operational Plans and Technical Elements

- Mockup and Area Charts Presentation Slide – Enhancing Market Analysis Clarity

- Question Mark Connection Diagram – Facilitating Business Strategy

- Capture Graphics for Message Delivery – Worry and Anxiety

- Visualizing Business Strategies with Boxed Step Diagram

- Legal Litigation Diagram – Visualizing Legal Processes

- Table of Contents for Marital Conflict Template - Foundation for Conflict Resolution

- Divorce Count Graph – Future Trends Analysis

- Alimony Ranking Graph – Visualizing Financial Performance

- Circular Diagram of Family Life - Vision and Strategy

- Work and Home Life Graph – Market Trends and Design Sensibility

- Visualizing the Asian Network with a Pie Chart Slide – Global Business Introduction

- Reasons for Divorce Counseling Analysis Diagram – Key Factors of Conflict

- Legal Dispute System Diagram Slide – Clearly Expressing Business Strategy

- Bar Chart for Marital Quarrel Survey – Innovative Approach

- Marriage Conflict Diagrams – Effective Solutions

- Marriage Conflict Progress Diagram – A Visual Tool for Relationship Improvement

- Marital Conflict Template Chapter – Concise and Emotional Design

- Black & Red Purple Donut Chart – Trendy Data Visualization

- 3 Main Tables and Summary Messages for Financial Insights

- Circular Strategy Diagram – Effectively Communicate Vision and Mission

- Graph Slide Visualizing Changes in Divorce Numbers

- Global Maps and Textboxes – Emphasizing Business Networks

- Marital Conflict Template Ending

- Visual Diagram Slide for Legal Dispute Process

- Bar Chart Analysis of Causes of Marital Conflict

- Infographic in a Woman's Head – Data Analytics and Customer Insight

- Infographic in a Man's Head – Simple Visual Appeal

- Couples Conflict Photos and Messages – Understanding Emotions and Dynamics

- The Difference in the Ratio of Men and Women by Age – Gender Customer Analysis

Add to Collection

  • No collections created.

TOP