Graph Slide Visualizing Changes in Divorce Numbers
RJ0600076_33
- Last Update 07/10/2025
- File Size 0.5MB
- # of Slides 2
- File Format PPTX
- Slide Ratio 16:9
- Color
Keywords
- #Content-Based Slides
- #Design-Based Slides
- #Market and Competitor Analysis
- #Graph
- #Text Box
- #Industry Trends
- #Competitive Advantage
- #Column
- #Grouped Column
- #Speech Bubble
- #16:9
- #vertical bar chart PowerPoint
- #bar graph slide template
- #data comparison chart
- #year-over-year trend visualization
- #statistical chart PowerPoint
- #how to create bar chart in PowerPoint
About the Product
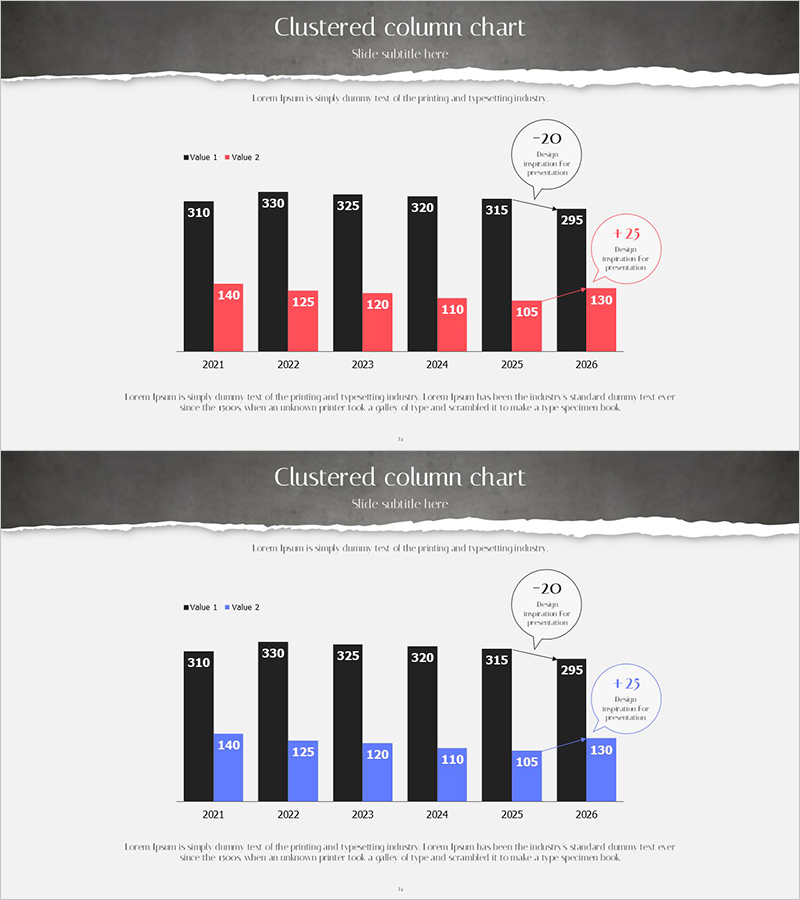
A vertical bar chart PowerPoint slide that clearly visualizes year-over-year changes in divorce numbers from 2021 to 2026. The data is presented in two distinct color series (black and red, or black and blue), with numerical values displayed directly on each bar for precise comparison. This slide is ready to use in company presentations, market analysis reports, social statistics presentations, and business documents where trend changes need to be emphasized. The 2-slide set includes color variations allowing you to match your presentation's visual tone while maintaining consistent data structure and layout.
Usage Points
-
Main Usage
Designed to compare year-over-year divorce statistics through numerical data visualization. The bar heights and value labels enable instant trend recognition, making it ideal for social statistics, market analysis, policy reports, and any presentation requiring temporal change emphasis.
-
How to Use
Insert into the market analysis, statistics overview, or social issues section of your presentation to support data-driven arguments. Edit bar colors and values with your own data for immediate use. The dual-series comparison structure is perfect for scenarios requiring contrastive analysis.
-
Recommended For
Recommended for sociology and statistics presentations, policy reports, market research documents, academic paper presentations, and social phenomenon analysis. Particularly valuable when you need to persuade audiences with objective numerical evidence of change over time.
-
Slide Structure
Six-year vertical bar structure (2021–2026) with two data series (black/red or black/blue). Numerical labels positioned above each bar, legend included, two callout bubbles (+20, +25) for highlighting specific data points. Two-slide set with color variations.
Related Products
-

Coverage and Trends Graph – Market Trends and Competitive Analysis
#Market and Competitor Analysis #Graph #Industry Trends
-

Five Color Powerpoint Template Wide – Charts and Mockups
#Market and Competitor Analysis #Graph #Other
-

3D Stacked Bar Breakdown - Market and Competitor Analysis
#Market and Competitor Analysis #Graph #Industry Trends
-

Dual Line Chart with Comments – Market Trend Analysis
#Market and Competitor Analysis #Graph #Text Box
