Black & Red Purple Donut Chart – Trendy Data Visualization
RJ0600076_30
- Last Update 07/10/2025
- File Size 0.5MB
- # of Slides 2
- File Format PPTX
- Slide Ratio 16:9
- Color
Keywords
About the Product
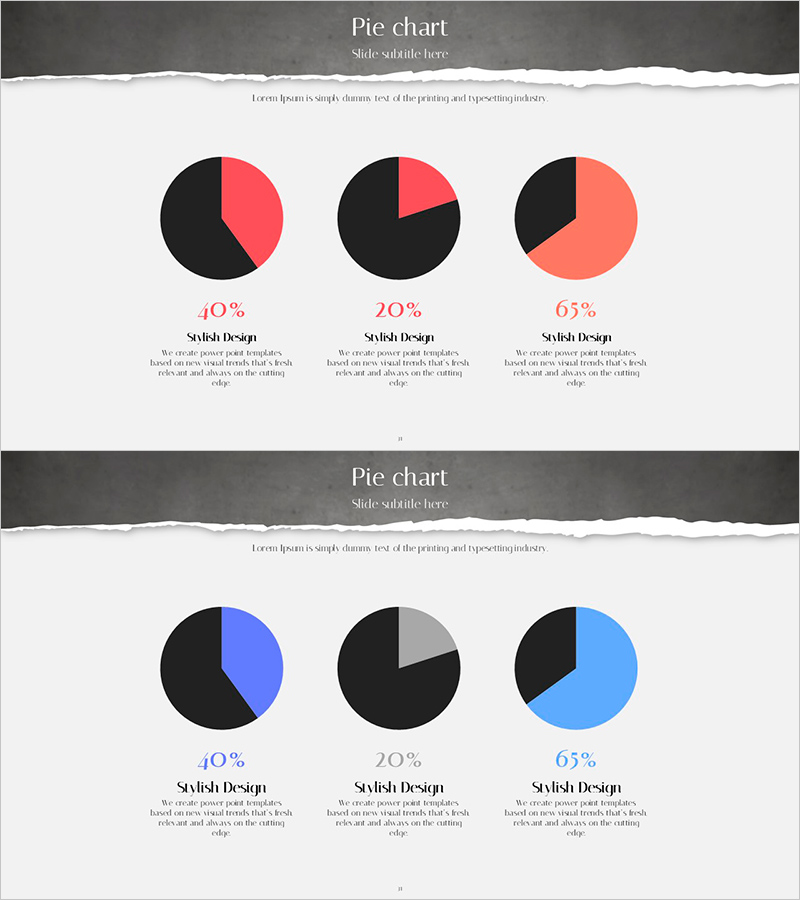
A professional pie chart PowerPoint slide featuring black, red, and purple color contrast for clear data representation. The 2-slide deck showcases multiple ratio-based visualizations with three segments per chart, ideal for presenting company performance, market share, budget allocation, and composition analysis. Each chart is fully editable with customizable labels and percentages. The 16:9 widescreen format ensures compatibility with modern projectors and displays, making it perfect for corporate presentations and business reports.
Usage Points
-
Main Usage
Designed to present composition data and percentage breakdowns in business contexts. Effectively communicates market share distribution, budget allocation, customer segmentation, and performance metrics. Each chart operates independently while maintaining consistent color coding throughout the presentation.
-
How to Use
Double-click on chart values and labels to edit directly. Percentages update automatically as you modify the data. Colors are adjustable via RGB values, and legends and titles can be customized freely. The 16:9 format is optimized for widescreen display presentations.
-
Recommended For
Finance teams presenting quarterly results, marketing departments analyzing customer segments, executive reports explaining business composition, academic presentations of survey data. Ideal for any presentation requiring 3-4 item ratio comparisons and percentage-based analysis.
-
Slide Structure
2-slide layout with 3 pie charts per slide. First slide displays 40%, 20%, and 65% ratio variations; second slide shows additional segment distributions. Black background with red, purple, and gray segments creates strong visual contrast. Each chart includes editable label and percentage input areas below.
Related Products
-

Recent Market Status Slide with Donut Chart
#Market and Competitor Analysis #Graph #Market Status
-

Radar Chart for Market Status Analysis – Broad Perspectives
#Market and Competitor Analysis #Graph #Market Status
-

User Analysis Graph by Age Group – Advanced Data Insights
#Market and Competitor Analysis #Diagram #Graph
-

Visualizing Trends with Area Chart – Intuitive Analysis
#Graph
