Bar Chart for Marital Quarrel Survey – Innovative Approach
RJ0600076_27
- Last Update 07/10/2025
- File Size 0.5MB
- # of Slides 2
- File Format PPTX
- Slide Ratio 16:9
- Color
Keywords
- #Content-Based Slides
- #Design-Based Slides
- #Technical Approach
- #Market and Competitor Analysis
- #Graph
- #Innovative Technologies and Future Plans
- #Future Outlook
- #Horizontal Bar
- #Grouped Horizontal Bar
- #16:9
- #horizontal bar chart PowerPoint
- #bar graph slide template
- #dual-series chart
- #data comparison PPT
- #survey data visualization
About the Product
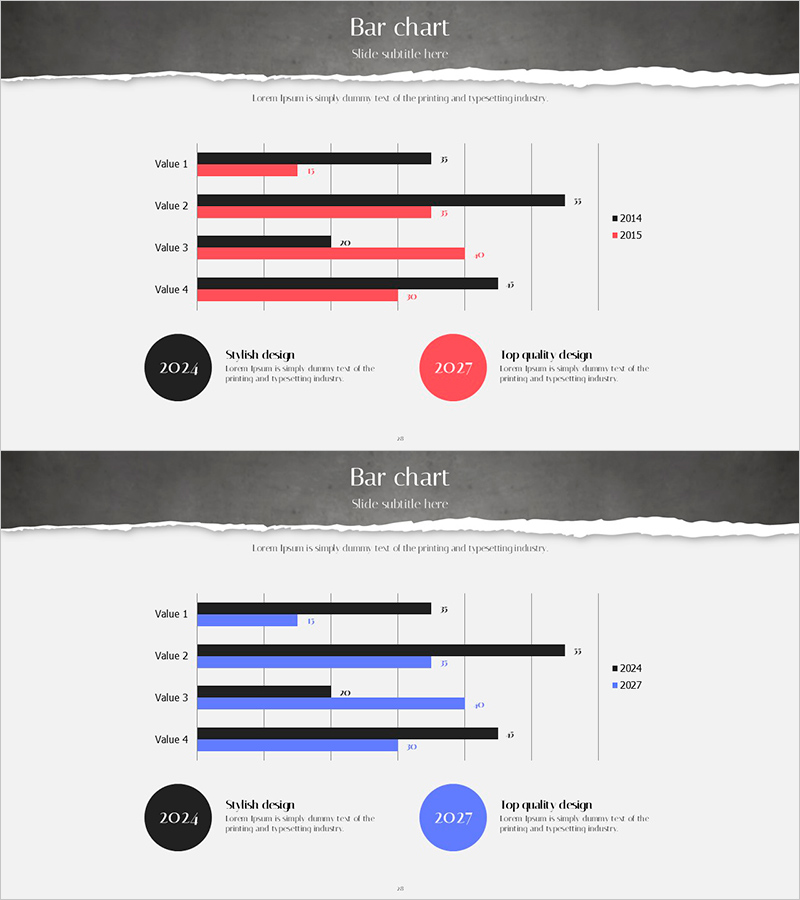
A horizontal bar chart PowerPoint slide designed for visualizing marital relationship survey data with dual-series comparison. This 2-slide set features two color combinations: black and red bars on the first slide, and black and blue bars on the second. Each slide displays four data items (Value 1–4) with clear numerical labels and legend indicators. The 16:9 widescreen PPTX format is fully editable and ready for immediate use in survey presentations, market research reports, performance comparisons, and data-driven business communications.
Usage Points
-
Main Usage
Ideal for comparing two time periods, two groups, or two data categories across four items simultaneously. The horizontal bar layout enables intuitive side-by-side comparison, while data labels provide precise numerical values. Perfect for survey results, market analysis, performance metrics, and year-over-year comparisons.
-
How to Use
Open the slides and replace Value 1–4 item names and numbers with your own data. Update the legend labels (e.g., 2024, 2027) to reflect your time periods or group names. Adjust colors as needed. Text boxes and bar lengths auto-fit, allowing quick customization without complex formatting.
-
Recommended For
Marketing teams presenting market research findings, HR departments sharing employee satisfaction surveys, executive reports comparing performance metrics, academic presentations analyzing survey data. Suitable for any presentation requiring two-group or two-period numerical comparison across multiple categories.
-
Slide Structure
2-slide set. Each slide contains a horizontal bar chart with 4 data items. Slide 1 uses black and red bars; Slide 2 uses black and blue bars. Each bar includes a numerical label, and a legend on the right displays time period or group names. Title area at top and descriptive text area at bottom allow easy context addition.
Related Products
-

Visualizing Business Strategy with Bar Charts – Market Analysis and Future Outlook
#Market and Competitor Analysis #Diagram #Graph
-

Presentation Slides on Future City Outlook
#Technical Approach #Market and Competitor Analysis #Innovative Technologies and Future Plans
-

Future Outlook Analysis Graph – Market and Competitive Analysis
#Market and Competitor Analysis #Graph #Other
-

Sales Status Average Slide
#Market and Competitor Analysis #Graph #Future Outlook
