The Difference in the Ratio of Men and Women by Age – Gender Customer Analysis
RJ0600076_9
- Last Update 07/10/2025
- File Size 0.5MB
- # of Slides 2
- File Format PPTX
- Slide Ratio 16:9
- Color
Keywords
- #Content-Based Slides
- #Design-Based Slides
- #Market and Competitor Analysis
- #Graph
- #Customer Analysis
- #Market Analysis
- #Column
- #Grouped Column
- #16:9
- #clustered column chart PowerPoint
- #gender comparison chart slide
- #age demographic data visualization
- #customer analysis graph template
- #how to create clustered chart in PowerPoint
- #gender distribution slide download
About the Product
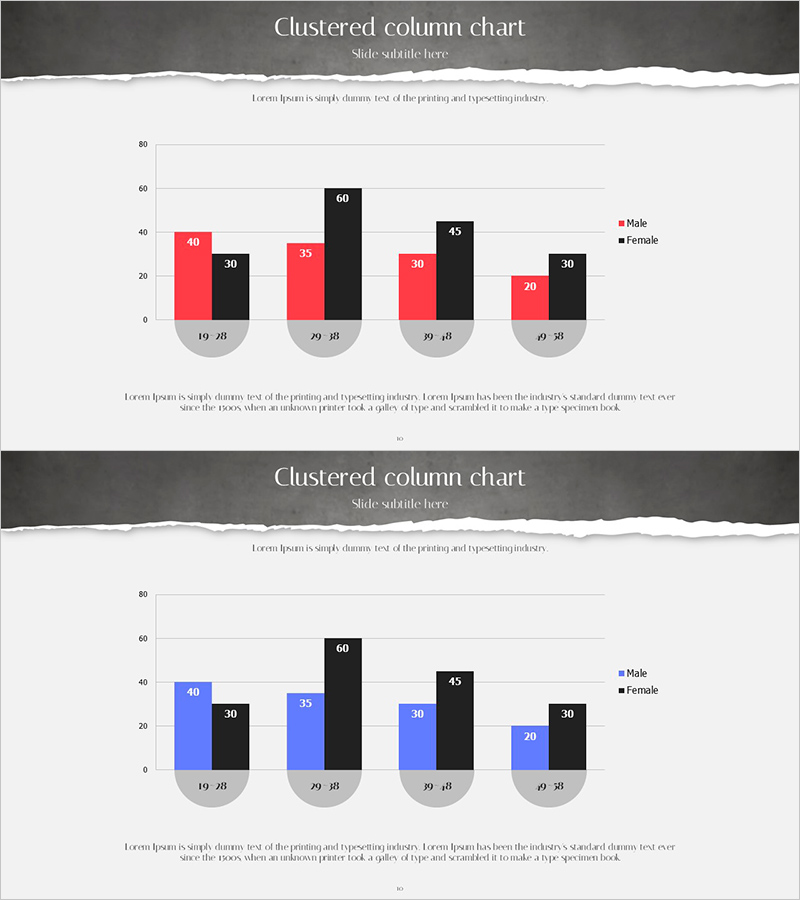
A clustered column chart PowerPoint slide visualizing customer gender distribution across age groups. The slide uses red and blue data series to represent male and female populations, enabling direct comparison across four age brackets. Optimized for 16:9 widescreen format with 2 slides, this template is ready for immediate use in customer analysis, market research, and demographic reporting presentations. Data labels appear above each column for precise value communication, while gray category backgrounds provide clear information hierarchy.
Usage Points
-
Main Usage
Designed to clearly visualize gender composition across age demographics in customer segmentation analysis. Supports marketing strategy development, target audience identification, and gender-based purchasing pattern analysis for data-driven decision making.
-
How to Use
Insert into market analysis or customer overview sections of marketing plans, business reports, and customer analysis presentations. Maintain the red (male) and blue (female) color scheme while inputting actual data values for immediate deployment.
-
Recommended For
Marketing teams, sales departments, executives, data analysts, and market research professionals presenting customer statistics, gender analysis, and age-based market conditions. Particularly valuable for consumer goods, financial services, telecommunications, and retail industry presentations.
-
Slide Structure
Two-slide template featuring four age brackets (19-28, 29-38, 39-48, 49-58) with clustered columns for each demographic. Red and blue data series bars are positioned side-by-side for intuitive comparison, with value labels and legend supporting data interpretation.
Related Products
-

User Analysis Graph by Age Group – Advanced Data Insights
#Market and Competitor Analysis #Diagram #Graph
-

User Analysis Bar Graph – Providing Customer Insights
#Market and Competitor Analysis #Graph #Customer Analysis
-

Comparative Chart of Male and Female Professionals
#Market and Competitor Analysis #Graph #Other
-

User Rating Analysis Chart – Visualizing Customer Insights
#Market and Competitor Analysis #Diagram #Graph
