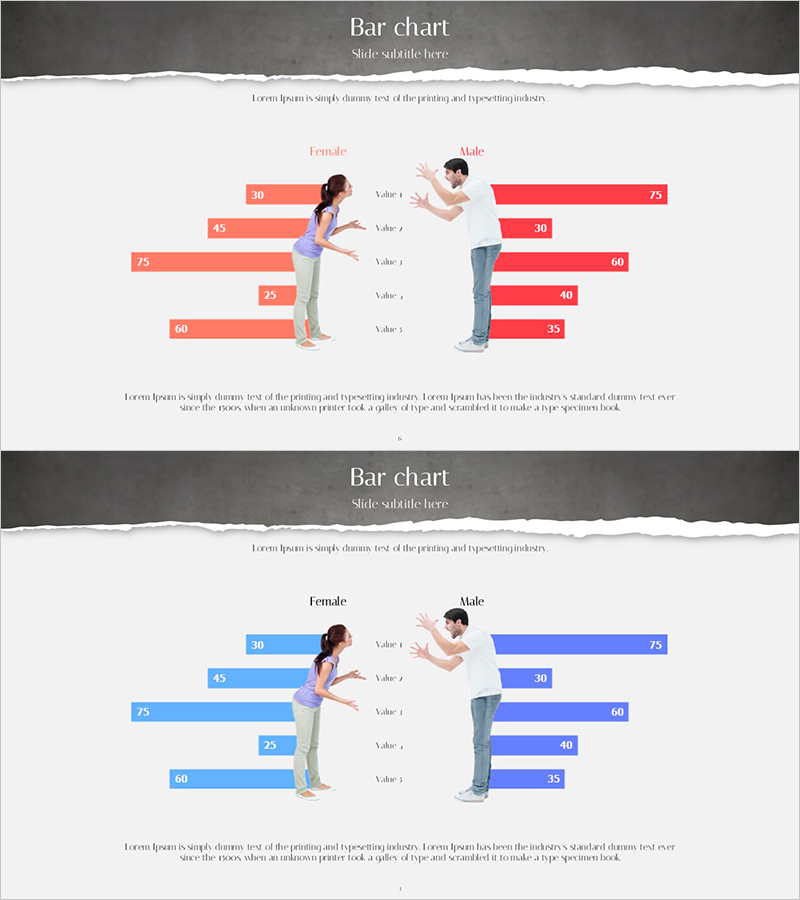
Bar Chart Analysis of Causes of Marital Conflict
RJ0600076_5
- Last Update 07/10/2025
- File Size 0.9MB
- # of Slides 2
- File Format PPTX
- Slide Ratio 16:9
- Color
Keywords
- #Content-Based Slides
- #Design-Based Slides
- #Market and Competitor Analysis
- #Graph
- #Customer Analysis
- #Market Analysis
- #Horizontal Bar
- #Double Horizontal Bar
- #16:9
- #diverging bar chart PowerPoint
- #gender comparison graph slide
- #male female data visualization
- #horizontal bar chart template
- #demographic analysis presentation
About the Product
A diverging bar chart PowerPoint slide that compares male and female data in a left-right symmetrical layout. Five data items are displayed with coral and blue color series, making numerical comparisons instantly visible. Real-life character illustrations positioned at the center enhance visual engagement and context. This presentation slide is ready to use for marital conflict analysis, market research, customer segmentation, and any gender-based comparative analysis. The 2-slide set includes color variations (coral and blue palettes) optimized for 16:9 widescreen format.
Usage Points
-
Main Usage
This slide visualizes gender-based data comparison using a symmetrical left-right bar structure. It clearly illustrates differences between male and female perspectives on marital conflict causes, market preferences, or customer characteristics, with central character illustrations providing intuitive context.
-
How to Use
Insert this slide in the analysis or results section of your presentation when presenting gender-comparative data. Assign the left coral-colored bars to female data and right blue bars to male data. The numerical labels display automatically, making editing straightforward and efficient.
-
Recommended For
Suitable for marketing plans, market research reports, customer analysis documents, organizational culture improvement presentations, and gender-characteristic analysis seminars. Recommended for HR professionals, marketing teams, researchers, and executive briefings.
-
Slide Structure
2-slide set with symmetrical layout. Each slide features a center dividing line with left side (female data, coral bars) and right side (male data, blue bars) displaying 5 comparative items. Male and female character illustrations positioned centrally, with title and legend at top, descriptive text area at bottom.
Related Products
-

Market and Competitor Analysis Horizontal Bar Graph – Visual Insights into Data
#Market and Competitor Analysis #Graph #Customer Analysis
-

User Gender Ratio Analysis Graph – Effective Customer Insights
#Market and Competitor Analysis #Graph #Customer Analysis
-

User Usage Analysis Status Graph
#Market and Competitor Analysis #Graph #Other
-

Simple PPT Wide Template for Customer Analysis
#Market and Competitor Analysis #Customer Analysis #Market Analysis
