Visual Diagram Slide for Legal Dispute Process
RJ0600076_4
- Last Update 07/10/2025
- File Size 0.7MB
- # of Slides 2
- File Format PPTX
- Slide Ratio 16:9
- Color
Keywords
About the Product
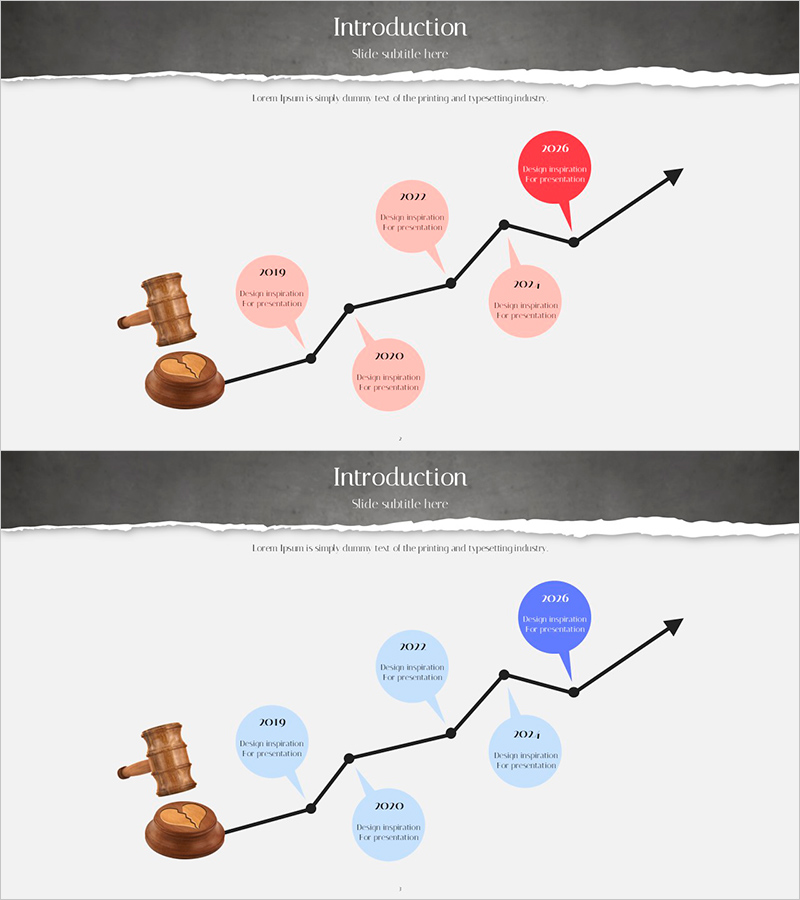
A PowerPoint slide that visualizes a legal dispute process through a 5-stage linear flow diagram. Starting with a gavel and round table icon, the design uses a black connecting line to guide viewers through year-by-year progression stages, each marked with pink and red speech bubbles for emphasis. Each stage includes editable text areas for detailed descriptions, making it ideal for presenting business strategies, project timelines, dispute resolution procedures, and other sequential processes. Formatted in 16:9 PPTX with 2 slides, ready for immediate editing and presentation.
Usage Points
-
Main Usage
Clearly visualizes sequential processes such as legal disputes, business initiatives, and project timelines through distinct stages. The gavel and round table icon emphasize the starting point, while the black connecting line and color-differentiated speech bubbles highlight the importance of each stage, enhancing audience comprehension.
-
How to Use
Enter relevant information—such as years, key events, and outcomes—into the editable text areas of each speech bubble to create a customized process flowchart. Modify colors or add icons to align with your organization's brand guidelines. Suitable for legal team reports, executive briefings, board presentations, and stakeholder communications.
-
Recommended For
Recommended for legal professionals, executives, project managers, and consultants who need to explain complex sequential processes. Ideal for presenting legal dispute resolution timelines, business initiative schedules, organizational restructuring plans, system implementation phases, and other time-ordered critical events to diverse audiences.
-
Slide Structure
2-slide set featuring a base version with 5 pink speech bubbles on the first slide and a red-accent emphasis version on the second. Each slide includes a gavel and round table icon (left side), black arrow connecting line, year labels (2019–2026), and editable text input areas, optimized for 16:9 aspect ratio.
Related Products
-

Structure Template Visualizing Business Strategy with Diagram
#Business Strategy #Diagram #Roadmap
-

Camera Aperture Diagram – The Beginning of Entry
#Business Strategy #Operational Plan #Diagram
-

Business Promotion System Diagram – Emphasizing Strategic Steps
#Product/Service Introduction #Business Strategy #Diagram
-

Visual Slide of 4-Step Process
#Business Strategy #Business Management #Diagram
