Reasons for Divorce Counseling Analysis Diagram – Key Factors of Conflict
RJ0600076_25
- Last Update 07/10/2025
- File Size 0.6MB
- # of Slides 2
- File Format PPTX
- Slide Ratio 16:9
- Color
Keywords
About the Product
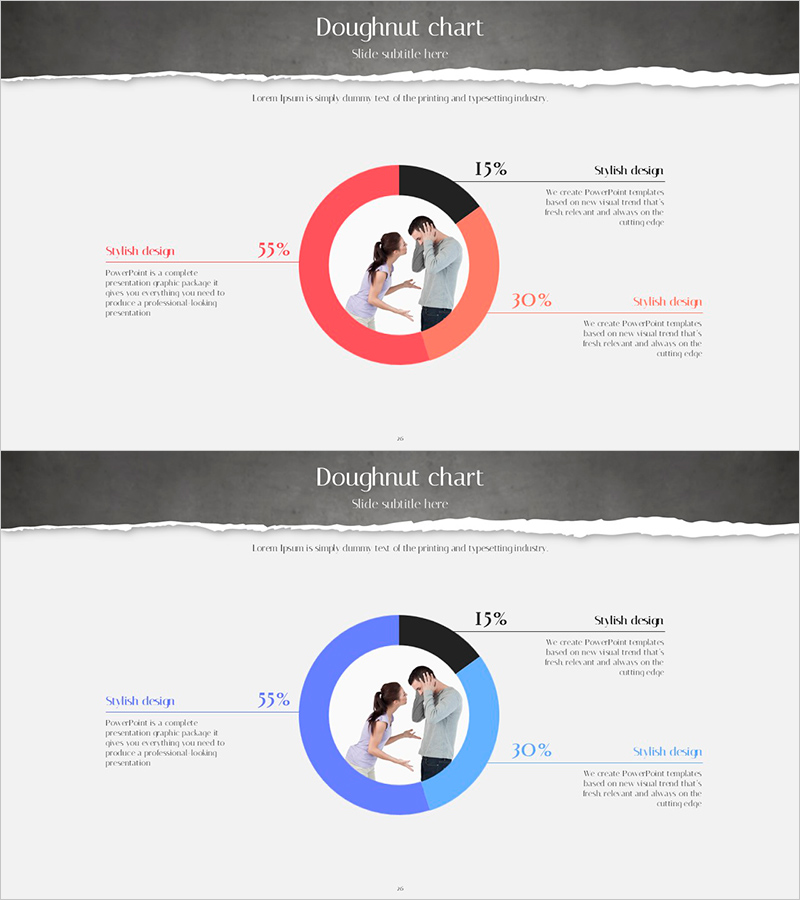
A doughnut chart PowerPoint slide with a central image area and three percentage segments arranged around the ring. Provided in two color versions—red and blue—allowing flexible customization for different presentation contexts. Each segment displays percentage values and accompanying text descriptions that can be easily edited. Ideal for visualizing customer analysis, market share distribution, factor analysis, and survey results. The 2-slide set enables you to select the color scheme that best matches your presentation theme.
Usage Points
-
Main Usage
Visualize ratio-based data using a doughnut chart with a central image area. Display three-item composition percentages (e.g., 15%, 55%, 30%) alongside descriptive text. Perfect for presenting customer segmentation, market share, factor analysis, survey findings, and organizational composition in a clear, visually engaging format.
-
How to Use
Double-click each percentage value to replace with your actual data. Edit the text boxes beside each segment to add item names and descriptions. Insert a relevant image or icon in the central circular area to reinforce your presentation topic. Choose between red or blue color versions to match your corporate branding.
-
Recommended For
Marketing professionals, executives, consultants, and research analysts presenting customer analysis, market research, survey results, and organizational metrics. Suitable for business reports, marketing plans, market analysis presentations, and customer segmentation documents.
-
Slide Structure
Two-slide set featuring red and blue doughnut chart variations. Each slide contains a central circular image placeholder, a doughnut ring divided into three segments with percentage labels (15%, 55%, 30% as examples), and editable text areas for segment descriptions.
Related Products
-

Visually Appealing Infographic Slide – Interesting Design
#Market and Competitor Analysis #Graph #Customer Analysis
-

Frustration and Leap Donut Chart
#Market and Competitor Analysis #Graph #Customer Analysis
-

Children's Competency Analysis Chart – Competitive Market Analysis
#Market and Competitor Analysis #Graph #Customer Analysis
-

Spotlight on Customer Segments – Market Share Network
#Market and Competitor Analysis #Graph #Customer Analysis
