Infographic in a Man's Head – Simple Visual Appeal
RJ0600076_7
- Last Update 08/28/2025
- File Size 0.5MB
- # of Slides 2
- File Format PPTX
- Slide Ratio 16:9
- Color
Keywords
- #Content-Based Slides
- #Design-Based Slides
- #Product/Service Introduction
- #Market and Competitor Analysis
- #Diagram
- #Other
- #Composition
- #Customer Analysis
- #Cluster
- #Inclusive Cluster Diagram
- #16:9
- #brain infographic PowerPoint
- #head diagram slide template
- #nested infographic slide
- #brain structure visualization
- #concept explanation PPT
- #infographic PowerPoint slide design
About the Product
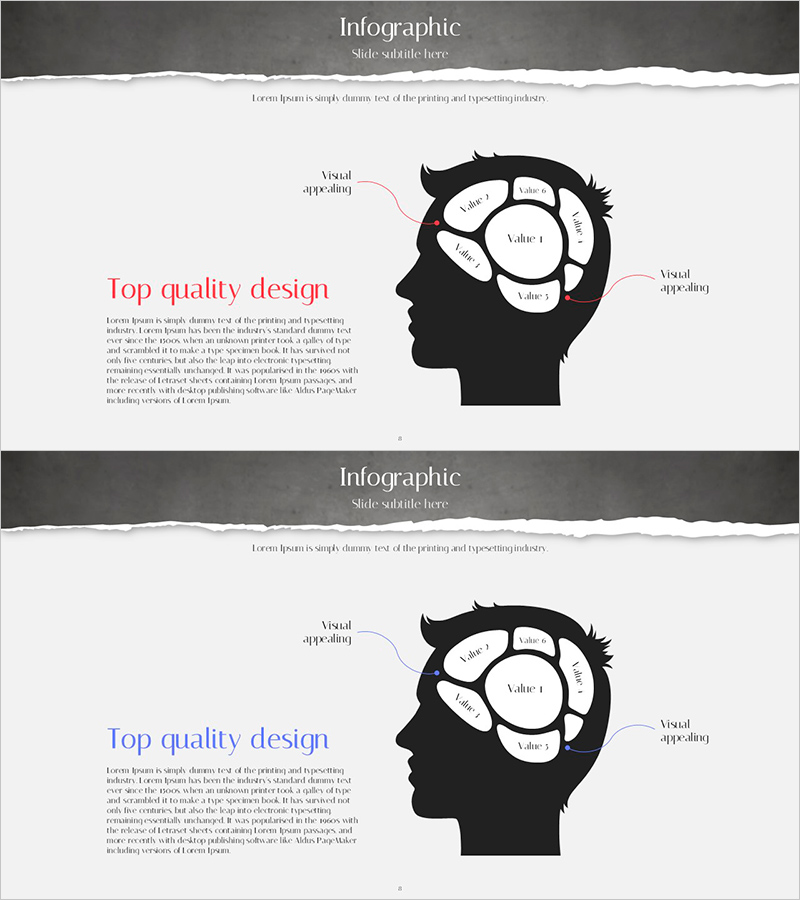
A nested infographic PowerPoint slide depicting the human brain in cross-section. Five circular zones are nested within a black silhouette of a head profile, each labeled with arrows for visual explanation. The layout features a dark gray header and white content area, creating clear information hierarchy. The left side provides space for text descriptions and key messages, while the right side diagram serves as an editable data field. Two slide variations with color options (red and blue) allow customization to match presentation themes. Instantly applicable for explaining brain functions, organizational structures, decision-making processes, learning frameworks, and cognitive concepts in business, education, and healthcare presentations.
Usage Points
-
Main Usage
Optimized for visually explaining brain functions, anatomical regions, and organizational structures. Five overlapping circular zones intuitively represent hierarchical concepts such as brain layers, decision-making workflows, or learning stages. Labels and arrows enable clear communication of complex information in a simple, digestible format.
-
How to Use
Enter key messages or titles in the left text area, then add corresponding data or descriptions to each zone on the right brain diagram. Use arrows and labels to clarify relationships between zones, and adjust colors to highlight priority areas. The two-slide format supports comparative analysis or step-by-step explanations.
-
Recommended For
Educational and training program presentations, neuroscience and psychology seminars, organizational development and leadership training, marketing strategy presentations (consumer psychology), product development process explanations, human resources management training, and healthcare or medical presentations. Ideal for educators, professors, HR professionals, marketing specialists, and healthcare practitioners.
-
Slide Structure
Two-slide set. Each slide features a dark gray header (title area) and white content section. Left side contains text input space (approximately 200 characters), while right side displays a black head silhouette with five nested circular zones. Each zone includes default 'Value 1–5' labels and directional arrows. Two color variations (red and blue) are provided for theme customization.
Related Products
-

Infographic in a Woman's Head – Data Analytics and Customer Insight
#Product/Service Introduction #Market and Competitor Analysis #Diagram
-

Contrast Highlight Customer Analysis Chart - Strategic Analysis for Competitors
#Business Strategy #Market and Competitor Analysis #Diagram
-

Businessperson Work Ability Analysis Graph – Successful Ability Assessment
#Product/Service Introduction #Market and Competitor Analysis #Diagram
-

Silhouette Diagram & Circle Donut Graph – Visual Tool for Customer Analysis
#Product/Service Introduction #Market and Competitor Analysis #Graph
