Analysis of Causes of Marital Conflict – Case Study Focus
RJ0600076_10
- Last Update 07/10/2025
- File Size 1.7MB
- # of Slides 2
- File Format PPTX
- Slide Ratio 16:9
- Color
Keywords
- #Content-Based Slides
- #Design-Based Slides
- #Business Vision and Strategy
- #Market and Competitor Analysis
- #Diagram
- #Business Background and Necessity
- #Market Analysis
- #Cluster
- #Closed Cluster Diagram
- #16:9
- #closed diagram PowerPoint
- #4-item comparison slide
- #case study presentation
- #comparison diagram slide template
- #PowerPoint analysis template
About the Product
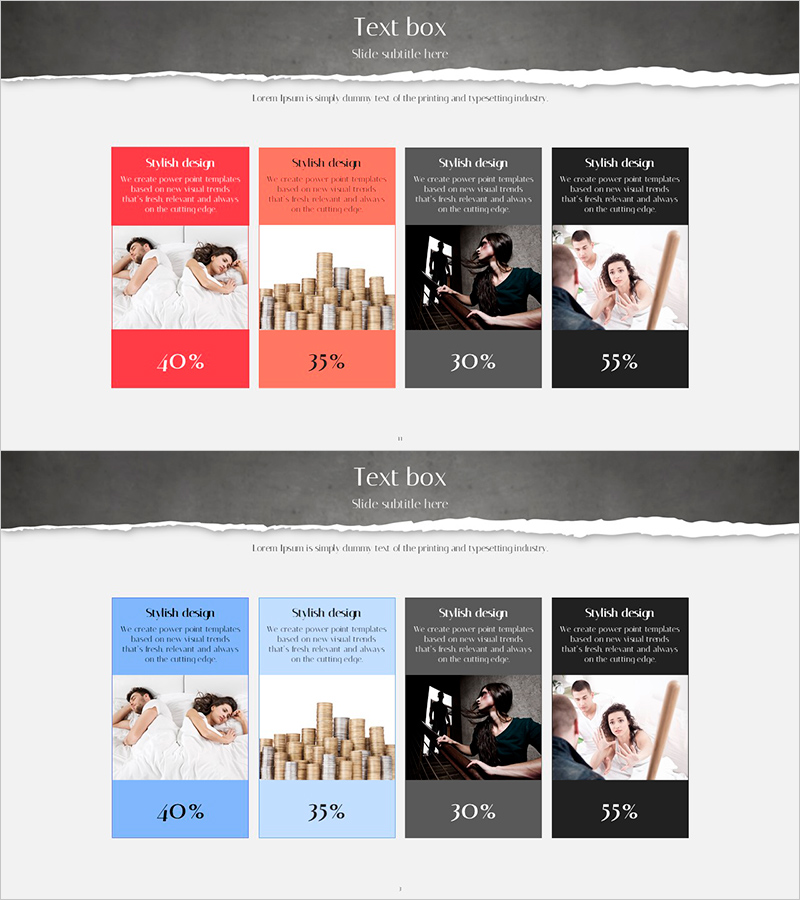
A closed-form comparison diagram PowerPoint slide designed to visually analyze four distinct items or case studies side by side. The card-based layout uses four distinct colors—red, orange, gray, and black—to differentiate each case and its characteristics. Each card features a text header area, central image space, and lower numerical indicator section, making it ideal for case research, market analysis, conflict analysis, and comparative studies. The 2-slide set is ready to edit and use immediately in presentations.
Usage Points
-
Main Usage
Optimized for comparing and analyzing four cases, items, or elements simultaneously. Each section combines text, imagery, and numerical data to help audiences instantly grasp differences and similarities across all four categories.
-
How to Use
Enter case names or item titles in the top text boxes, insert relevant photos or graphics in the central image areas, and add percentages or statistics in the bottom numerical sections. Colors automatically distinguish each category, reducing visual confusion.
-
Recommended For
Ideal for market research reports, case study presentations, conflict analysis, product comparison decks, educational seminars, and academic presentations. Commonly used by researchers, consultants, psychologists, sociologists, business analysts, and marketing professionals.
-
Slide Structure
2-slide set. Each slide contains four independent card sections, with each card divided into three zones: colored header (text), central image area, and bottom numerical indicator. Red, orange, gray, and black colors distinguish the four items.
Related Products
-

Financial Market Needs Analysis – Business Strategy with Visual Data Focus
#Business Vision and Strategy #Market and Competitor Analysis #Diagram
-

Characteristics of Seasonal Forests – Market and Competitor Analysis
#Market and Competitor Analysis #Diagram #Text Box
-

Healthcare Services Analytics Donut Chart – Insights into Competitive Markets
#Market and Competitor Analysis #Diagram #Graph
-

Data Analysis Business Structure Slide – Strategy and Cluster
#Product/Service Introduction #Business Vision and Strategy #Diagram
