Visualizing the Asian Network with a Pie Chart Slide – Global Business Introduction
RJ0600076_24
- Last Update 07/10/2025
- File Size 0.7MB
- # of Slides 2
- File Format PPTX
- Slide Ratio 16:9
- Color
Keywords
About the Product
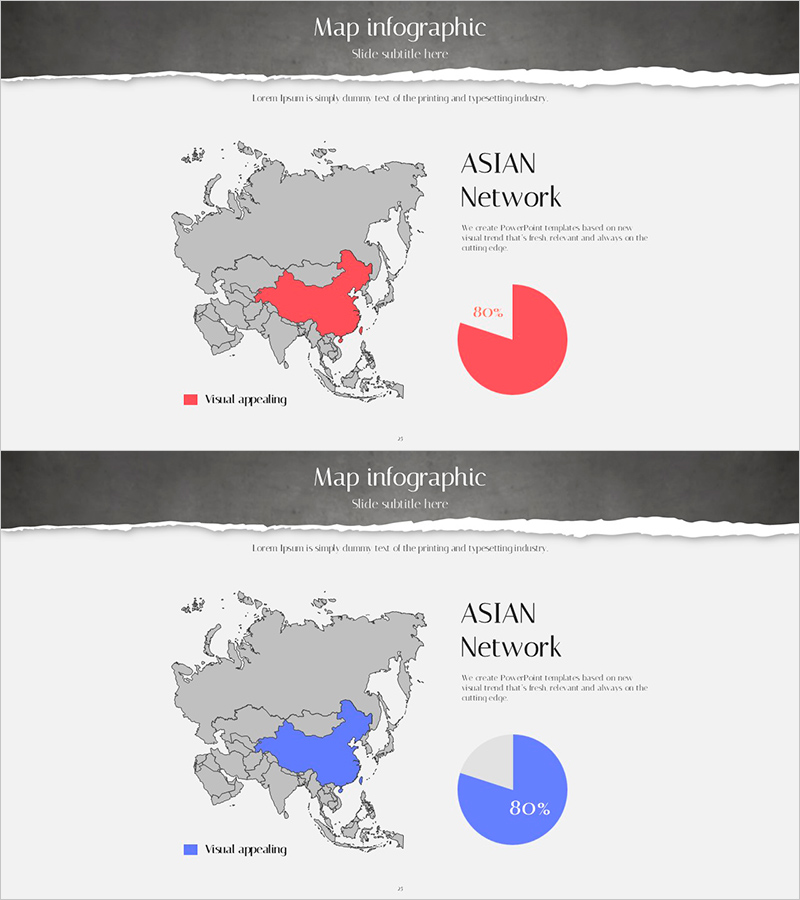
A PowerPoint slide set visualizing the Asian network and regional distribution through a world map and pie chart combination. This 2-slide presentation features a world map with highlighted Asia region on the left and an 80% pie chart on the right, available in red and blue color versions. The dual-color design allows you to match your brand identity and presentation theme. Ideal for global business introductions, regional market analysis reports, network status updates, and international expansion presentations that require clear data visualization.
Usage Points
-
Main Usage
Effectively communicate regional market share, network distribution, and business concentration in global presentations using pie chart visualization. The combination of world map and chart enables simultaneous delivery of geographic information and numerical data, enhancing audience comprehension and engagement.
-
How to Use
Highlight the target region on the world map using the provided color scheme, then input your actual percentage data into the pie chart. Customize the title and description text to match your presentation topic. Select either the red or blue color version to align with your corporate branding and visual identity.
-
Recommended For
International business professionals, marketing strategy presentations, regional business performance reports, investor relations meetings, and global network introductions. Suitable for consulting, finance, trade, IT, and other international business sectors requiring geographic and statistical data visualization.
-
Slide Structure
2-slide set with consistent layout. Each slide features a world map with highlighted Asia region (gray background with red or blue emphasis) on the left side, paired with an 80% pie chart and legend on the right. Title and description text areas positioned at the top for easy customization and editing.
Related Products
-

Market Analysis Slide for Major European Exporters
#Company Introduction #Market and Competitor Analysis #Graph
-

Fruit Importers and Proportions – Global Distribution Strategy
#Company Introduction #Marketing Plan and Strategy #Graph
-

Target Country Analysis Map – Insights into Global Markets
#Company Introduction #Market and Competitor Analysis #Graph
-

Layout Design Presentation Template with Europe Map
#Company Introduction #Market and Competitor Analysis #Graph
