3 Main Tables and Summary Messages for Financial Insights
RJ0600076_31
- Last Update 07/10/2025
- File Size 0.4MB
- # of Slides 2
- File Format PPTX
- Slide Ratio 16:9
- Color
Keywords
- #Content-Based Slides
- #Design-Based Slides
- #Financial Plans and Performance
- #Diagram
- #Text Box
- #Capital Requirements
- #Key Financial Indicators
- #Table
- #Standard Table
- #Speech Bubble
- #16:9
- #financial table PowerPoint slide
- #data comparison presentation template
- #financial analysis slide
- #performance summary PowerPoint
- #table slide design download
About the Product
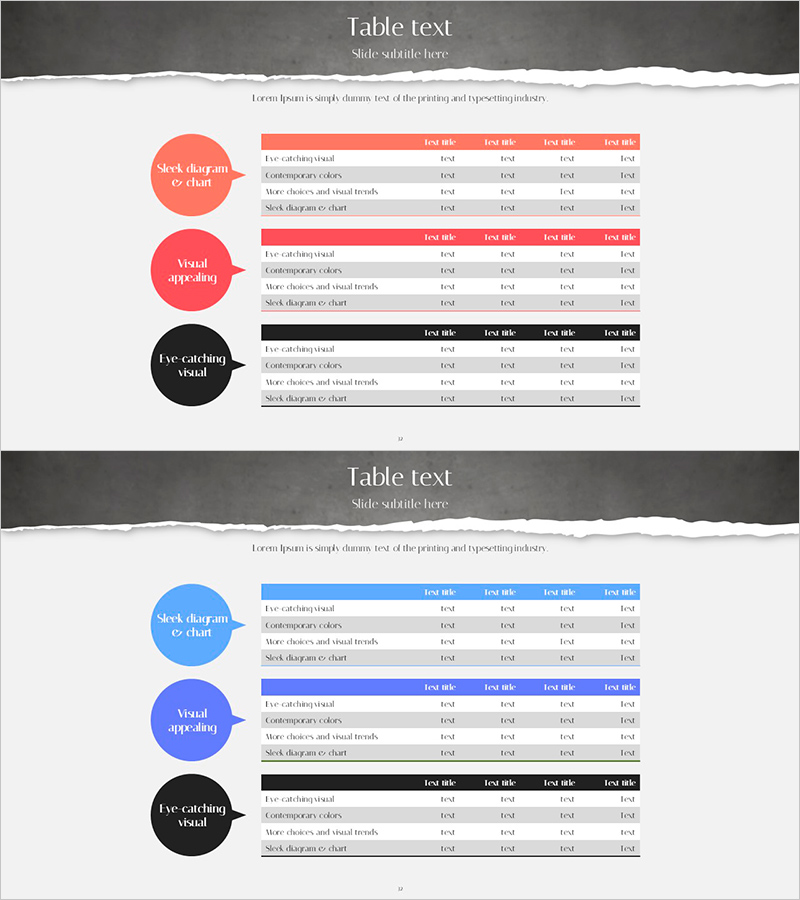
A professional PowerPoint slide template featuring three data comparison tables designed for financial analysis and performance summaries. Each table includes a color-coded circular label (red, blue, black) and four data columns for organizing financial metrics, market analysis, and key performance indicators. Optimized for 16:9 widescreen format across 2 slides, this template is ready to use in business presentations, financial reports, and strategic planning documents.
Usage Points
-
Main Usage
Present multiple financial datasets, market comparisons, and performance metrics simultaneously in a clear, organized format. Color-coded labels (red, blue, black) help audiences quickly distinguish between different data categories and improve information retention.
-
How to Use
Enter financial data and category names into each table's four columns. Customize the color-coded labels to match your presentation context. Use both slides consecutively or select individual tables as needed for your specific presentation requirements.
-
Recommended For
Finance professionals, executives, management consultants, and investor relations teams presenting quarterly results, financial performance, market analysis, and business metrics. Ideal for investor pitch decks, financial reports, strategic planning presentations, and board meetings.
-
Slide Structure
Two slides, each containing three data tables. Each table features a color-coded circular label (red, blue, black) and a four-column data entry structure. Total of 6 tables with 24 data cells for comprehensive financial information organization.
Related Products
-

Patient Examination Item Table Slide – Efficient Data Management
#Financial Plans and Performance #Diagram #Capital Requirements
-

Highlight Table Chart – Clear Visualization of Financial Performance
#Financial Plans and Performance #Diagram #Capital Requirements
-

Painting Template Table – Visualizing Financial Plans
#Financial Plans and Performance #Diagram #Capital Requirements
-

Curved Theme Purple Template Diagram – Key to Financial Planning
#Financial Plans and Performance #Diagram #Capital Requirements
