Work and Home Life Graph – Market Trends and Design Sensibility
RJ0600076_23
- Last Update 07/10/2025
- File Size 0.5MB
- # of Slides 2
- File Format PPTX
- Slide Ratio 16:9
- Color
Keywords
About the Product
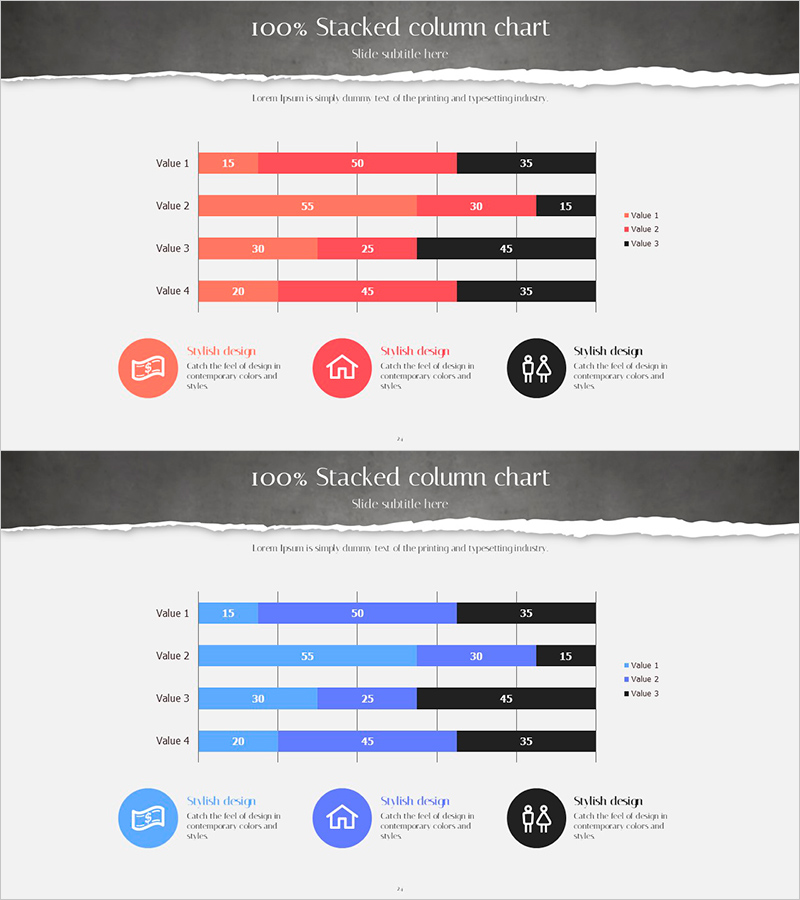
A horizontal stacked bar chart PowerPoint slide designed to visualize work-life balance and market trend data. The slide displays 4 values (Value 1–4) across 3 data series, enabling clear ratio comparison and composition analysis. The red, blue, and black color scheme distinguishes data layers, while numeric labels on each bar segment ensure precise information delivery. This PowerPoint template is ready to use for business presentations including market analysis, competitive benchmarking, performance metrics, and stakeholder reporting. Two slide variations (red and blue versions) allow you to match your presentation tone and corporate branding.
Usage Points
-
Main Usage
Designed to compare complex multi-series data such as work-life balance metrics across 4 categories and 3 data series. Numeric labels on each bar segment enable instant comprehension of exact ratios. Ideal for market trend analysis, competitive positioning, departmental performance comparison, and quantitative business presentations.
-
How to Use
Two slide layouts are provided: red version and blue version with identical structure. Select the color variant that matches your presentation tone (positive, neutral, or cautionary). Double-click numeric values to replace with your actual data, and edit the title and legend to align with your presentation context. All elements are fully editable in PowerPoint.
-
Recommended For
Executive reports, business plans, marketing strategy presentations, quarterly performance reviews, market research reports, and competitive analysis documents. Recommended for finance teams, marketing departments, strategy offices, and sales teams requiring data-driven decision-making presentations.
-
Slide Structure
Each slide contains a title area, 4-row × 3-series horizontal stacked bar chart, legend (Value 1, 2, 3), and three icon-based explanation sections. Bars display 100% stacked composition with numeric labels on each segment, enabling precise ratio and value identification across all data series.
Related Products
-

Bar Chart for Eco-friendly Practices Trends Visualization
#Market and Competitor Analysis #Graph #Industry Trends
-

Visualizing Camping Business Market Share with Bar Chart
#Market and Competitor Analysis #Graph #Industry Trends
-

Analyzing Flower Horizontal Segmentation Charts – Understanding Market Trends
#Market and Competitor Analysis #Graph #Industry Trends
-

Memorable Travel Destinations Survey Slide – Market and Competitive Analysis
#Market and Competitor Analysis #Graph #Industry Trends
