Mockup and Area Charts Presentation Slide – Enhancing Market Analysis Clarity
RJ0600076_15
- Last Update 07/10/2025
- File Size 0.6MB
- # of Slides 2
- File Format PPTX
- Slide Ratio 16:9
- Color
Keywords
- #Content-Based Slides
- #Design-Based Slides
- #Market and Competitor Analysis
- #Financial Plans and Performance
- #Graph
- #Other
- #Market Status
- #Sales and Revenue
- #Mockup
- #16:9
- #area chart PowerPoint slide
- #area chart presentation template
- #laptop mockup slide
- #market analysis chart PPT
- #financial performance visualization slide
About the Product
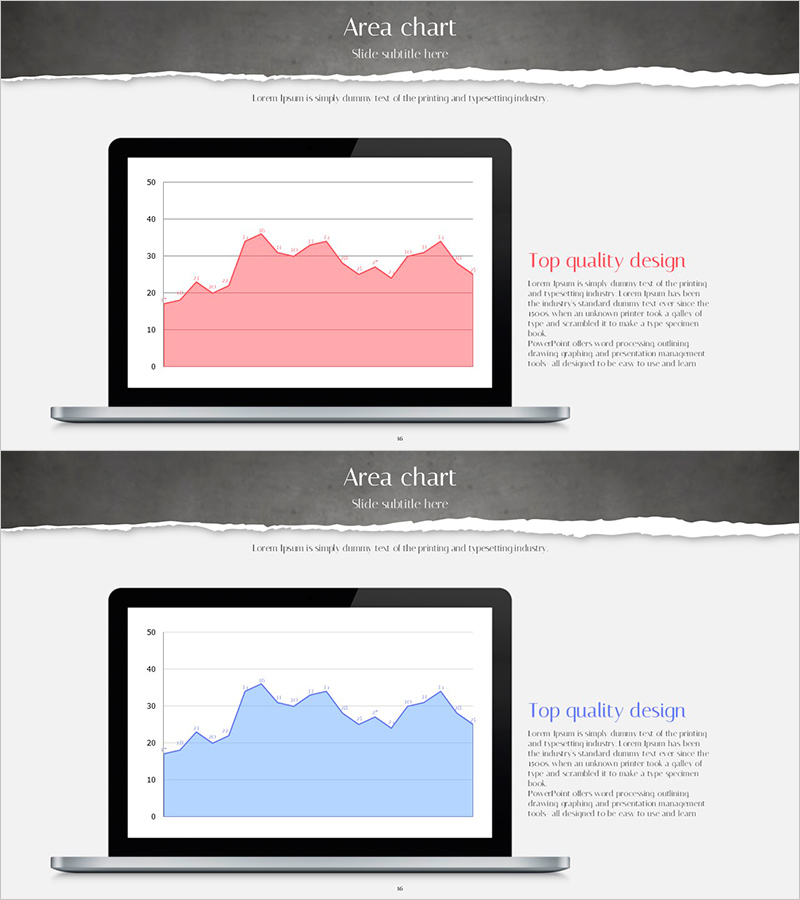
An area chart PowerPoint slide designed to visualize market analysis and financial performance with a laptop mockup layout. This presentation slide enhances credibility through a realistic notebook display format and offers two color versions: pink and blue. Each slide features a dark header section at the top, a central chart area within the laptop mockup, and a right-side text description space for detailed insights. Ideal for reports, investor presentations, and business analysis decks, this slide effectively communicates data-driven trends and supports informed decision-making.
Usage Points
-
Main Usage
Visualize time-series data such as market trends, financial performance, and sales growth using area charts to present evidence-based insights. The laptop mockup layout reinforces presentation credibility and professionalism, while pink and blue color options allow easy customization to match brand guidelines.
-
How to Use
Use in investor relations materials, quarterly performance reports, marketing analysis presentations, and financial briefings to communicate data-driven insights effectively. The laptop display format reflects real-world business environments, increasing audience engagement and comprehension of complex data.
-
Recommended For
Finance teams, marketing professionals, executive report writers, data analysts, management consultants, and investor relations specialists preparing data-backed presentations and analytical reports.
-
Slide Structure
2-slide set. Each slide contains a dark header section (title and subtitle input areas), a central area chart within a laptop mockup (Y-axis range 0-50, X-axis showing time progression), and a right-aligned text box (3-4 lines of description space). Pink and blue color versions are provided separately.
Related Products
-

Highlighted Curved Graph for Market Analysis
#Market and Competitor Analysis #Financial Plans and Performance #Graph
-

Key Growth Drivers KPI Slide – Revenue, Efficiency, Customers
#Market and Competitor Analysis #Financial Plans and Performance #Graph
-

Idea Presentation Template for Visualizing Sales Status – Success and Challenge
#Market and Competitor Analysis #Financial Plans and Performance #Graph
-

Building Analysis Chart – Visualizing Market Status and Performance
#Market and Competitor Analysis #Financial Plans and Performance #Graph
