Divorce Count Graph – Future Trends Analysis
RJ0600076_20
- Last Update 07/10/2025
- File Size 0.7MB
- # of Slides 2
- File Format PPTX
- Slide Ratio 16:9
- Color
Keywords
About the Product
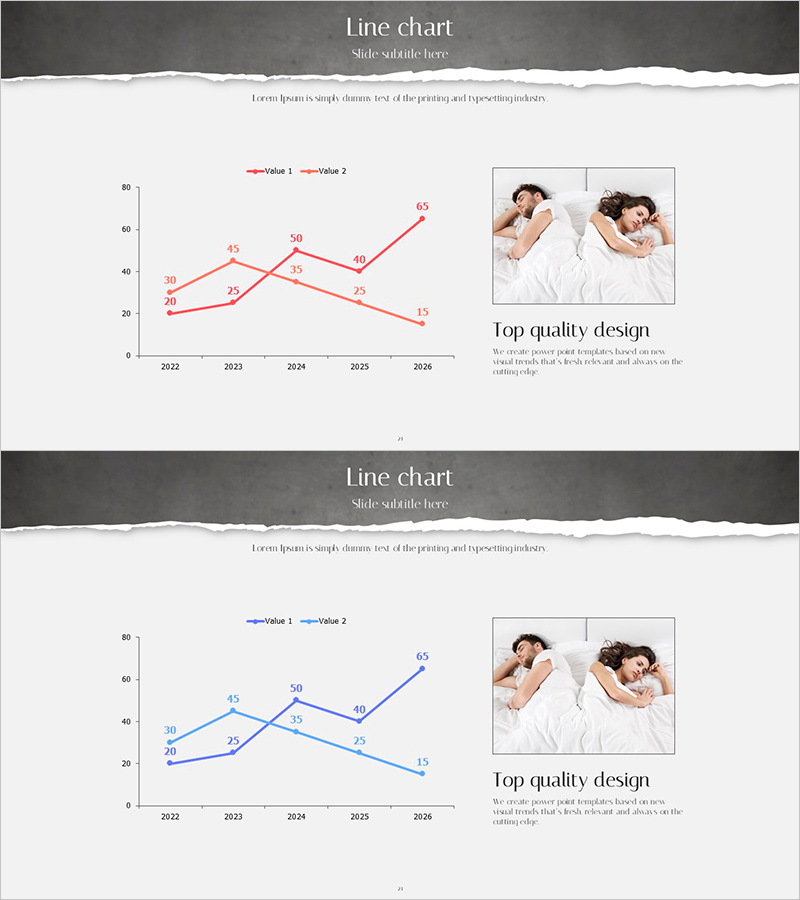
A dual-series line chart PowerPoint slide that compares data changes across a 5-year period from 2022 to 2026. Two distinct colored lines—red and orange—represent separate data streams, with numerical labels at each data point for precise value comparison. The Y-axis ranges from 0 to 80, providing clear scale reference. The right side of the slide features a dedicated area for images and text, allowing flexible customization to match your presentation content. This slide template is ready for immediate use in business presentations including market analysis, performance reporting, trend forecasting, and strategic planning.
Usage Points
-
Main Usage
Designed to simultaneously compare and analyze how two different data series change over time. Effectively visualizes business metrics, market trends, and performance indicators to support data-driven decision-making and strategic insights.
-
How to Use
Place this slide in the market analysis, competitive comparison, or future outlook sections of reports and proposals to strengthen quantitative arguments. Adding relevant images or icons to the right-side area enhances visual impact. Double-click data values to edit them directly.
-
Recommended For
Ideal for executive briefings, investor presentations, marketing strategy decks, and business performance analyses. Finance teams, marketing departments, business planning units, and consulting firms benefit from this template when presenting quantitative evidence.
-
Slide Structure
Two-line series (red and orange), five time points (2022–2026), Y-axis scale 0–80, numerical labels at each data point. Two-column layout with chart area on left and image/text area on right.
Related Products
-

Purple Turquoise Line Chart – Market Analysis and Future Outlook
#Market and Competitor Analysis #Graph #Future Outlook
-

Line Graph Market Research by Year – Market Trend Analysis
#Market and Competitor Analysis #Graph #Future Outlook
-

Line Graph and Key Messages – Market Outlook Analysis
#Market and Competitor Analysis #Graph #Future Outlook
-

Current Status Graph Analysis and Forecast – Market and Competitor Analysis
#Market and Competitor Analysis #Graph #Future Outlook
