주메뉴 바로가기 본문으로 바로가기
Modern Presentation Template – Flexible Design for Various Industries

Modern Presentation Template – Flexible Design for Various Industries

J0200042

  • Last Update 06/28/2025
  • File Size 28.2MB
  • # of Slides 30
  • File Format PPTX
  • Slide Ratio 16:9
  • Color

About the Product

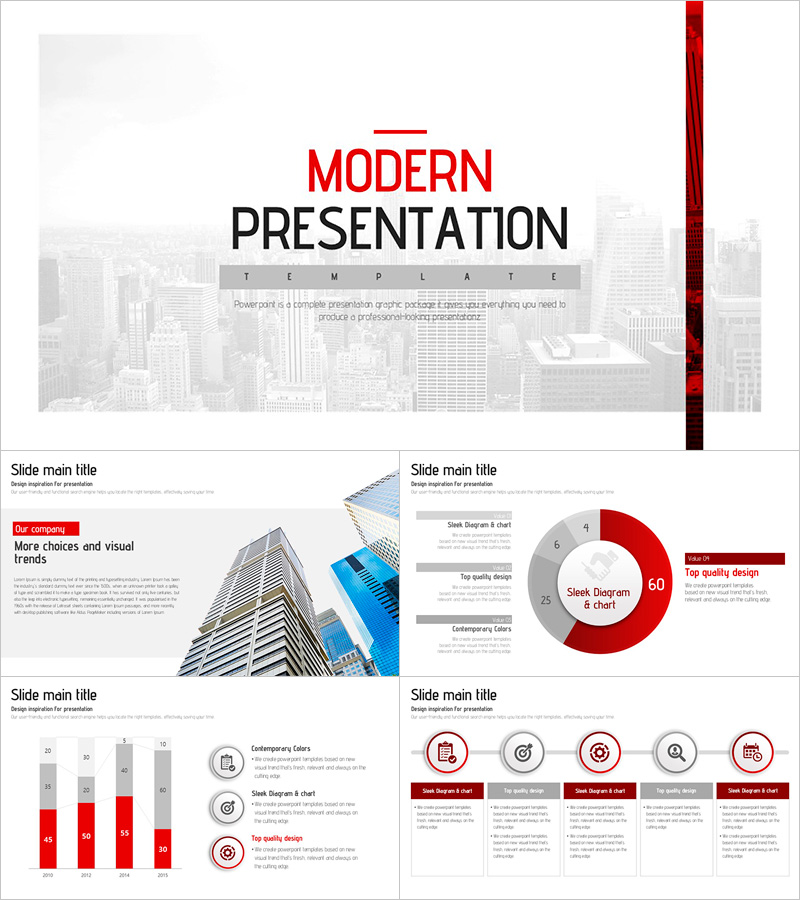
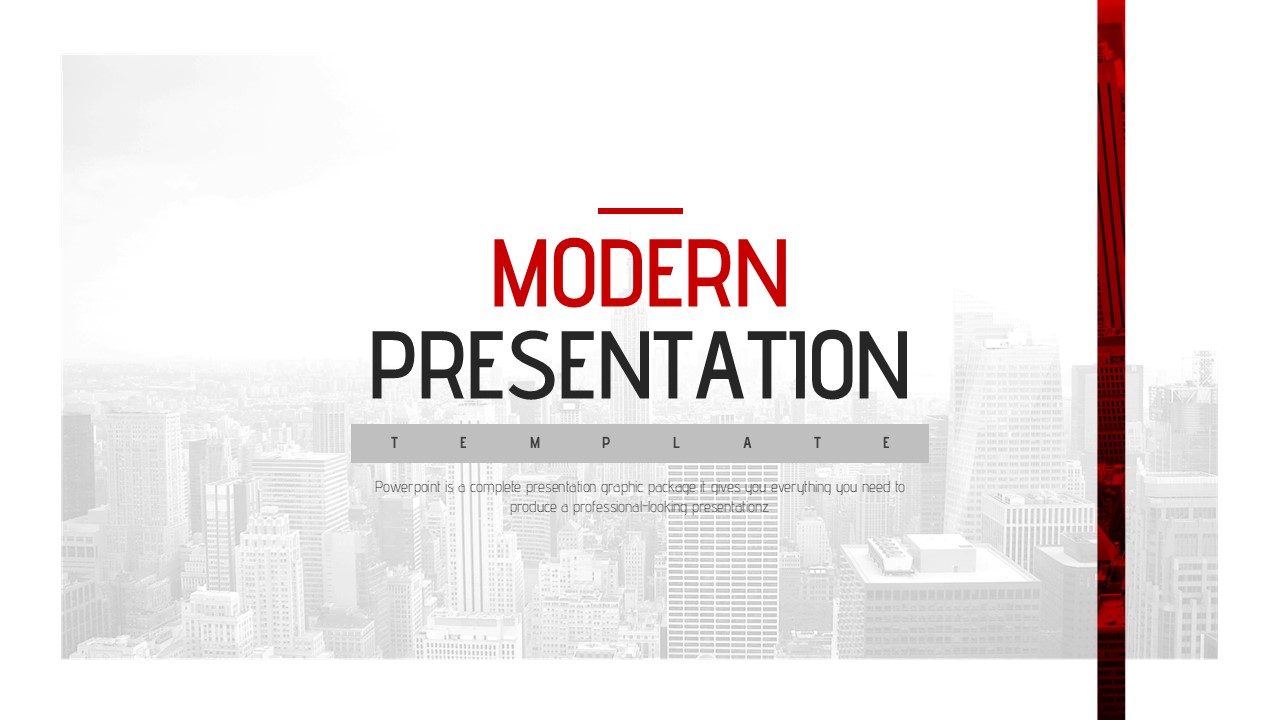
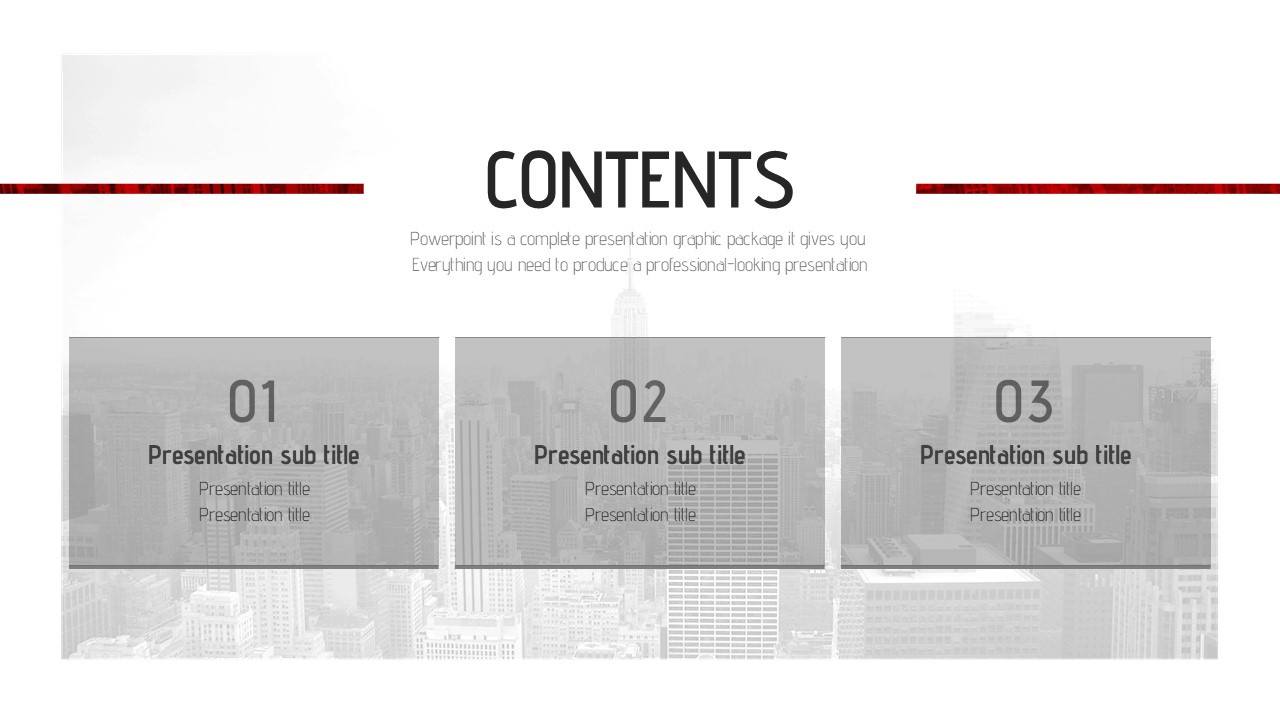
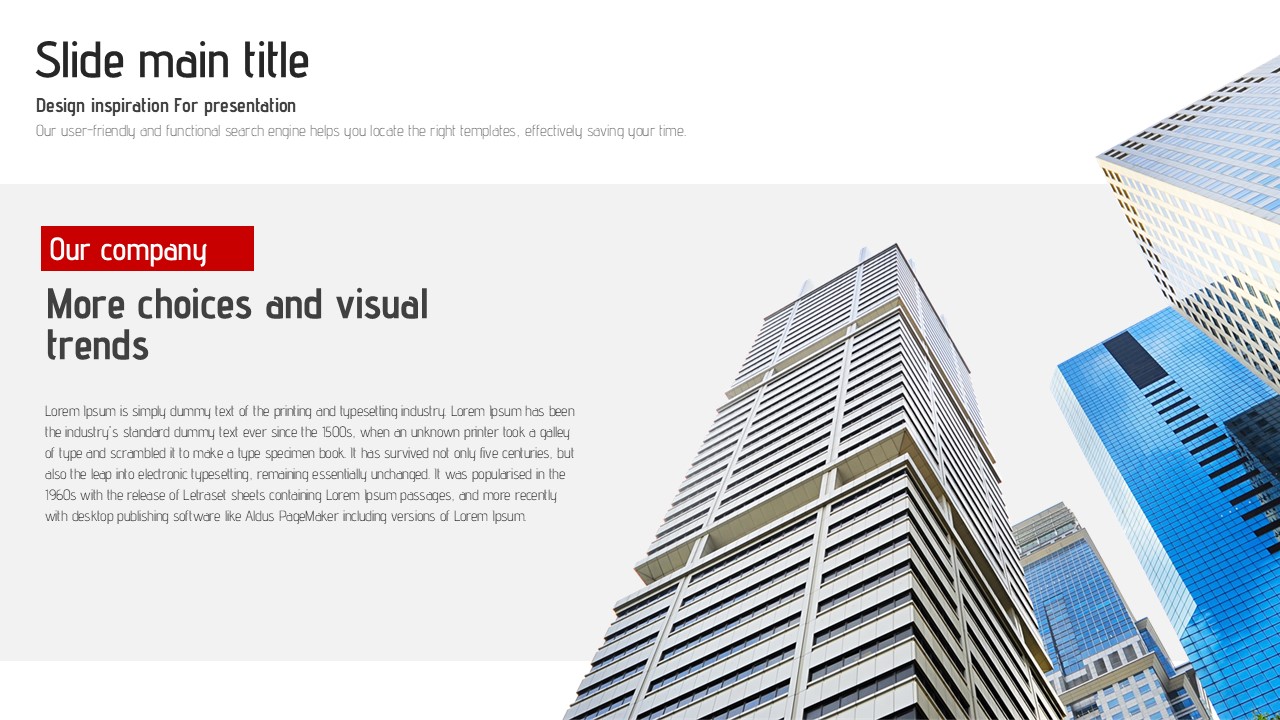
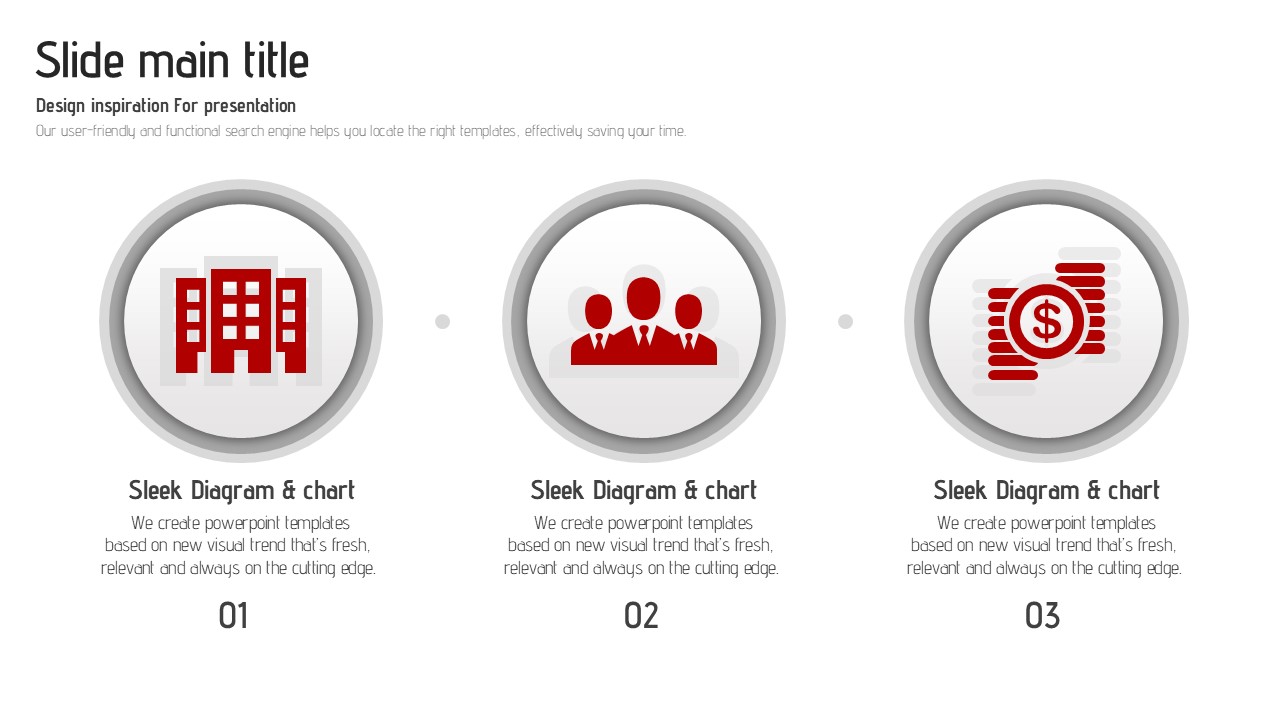
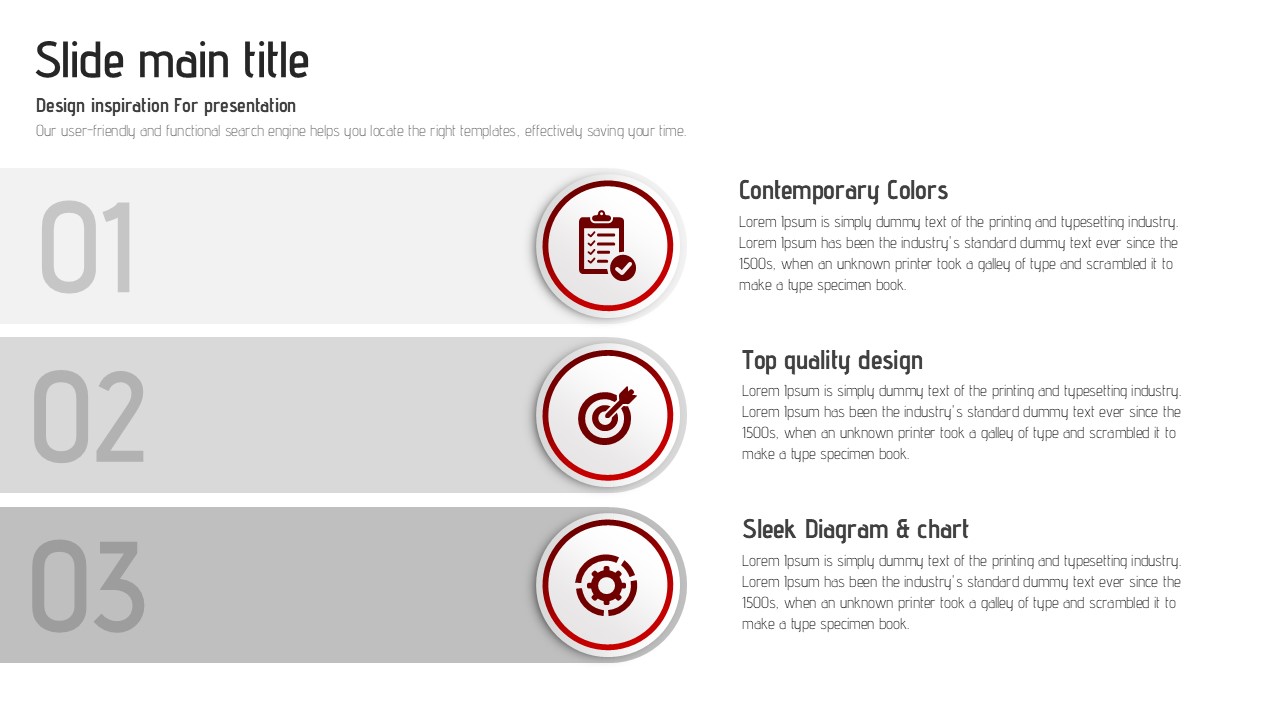
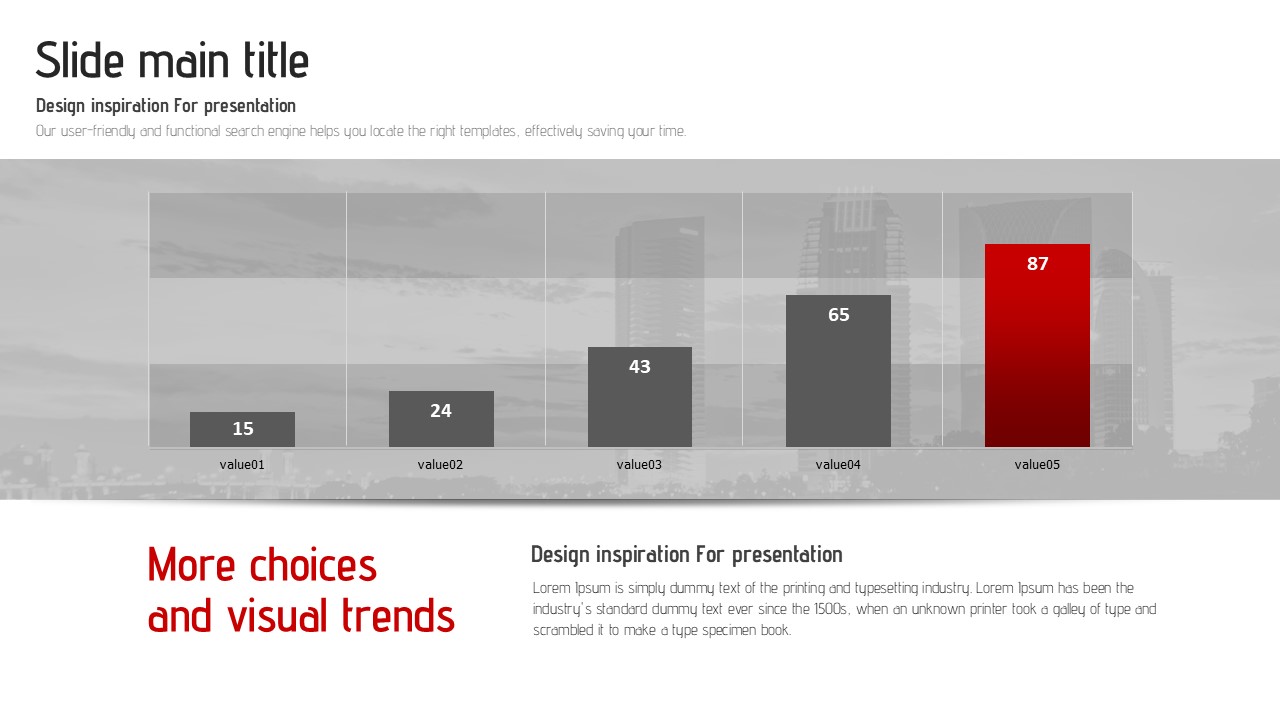
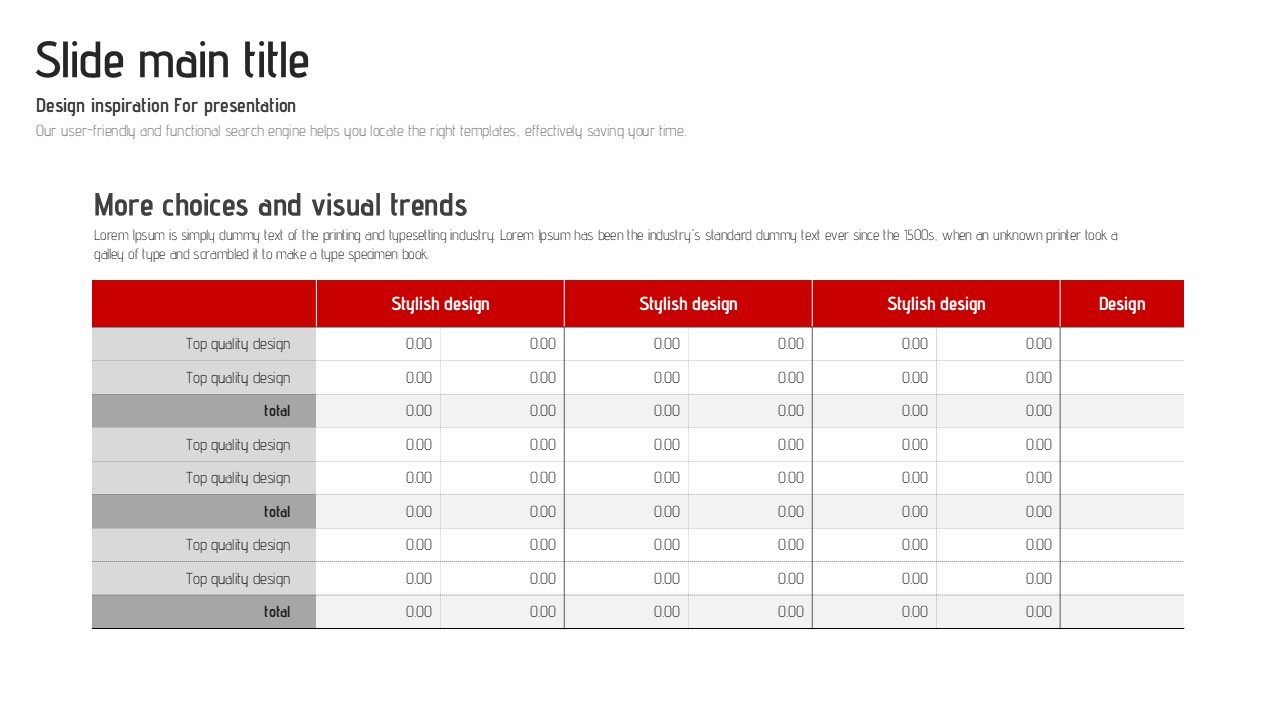
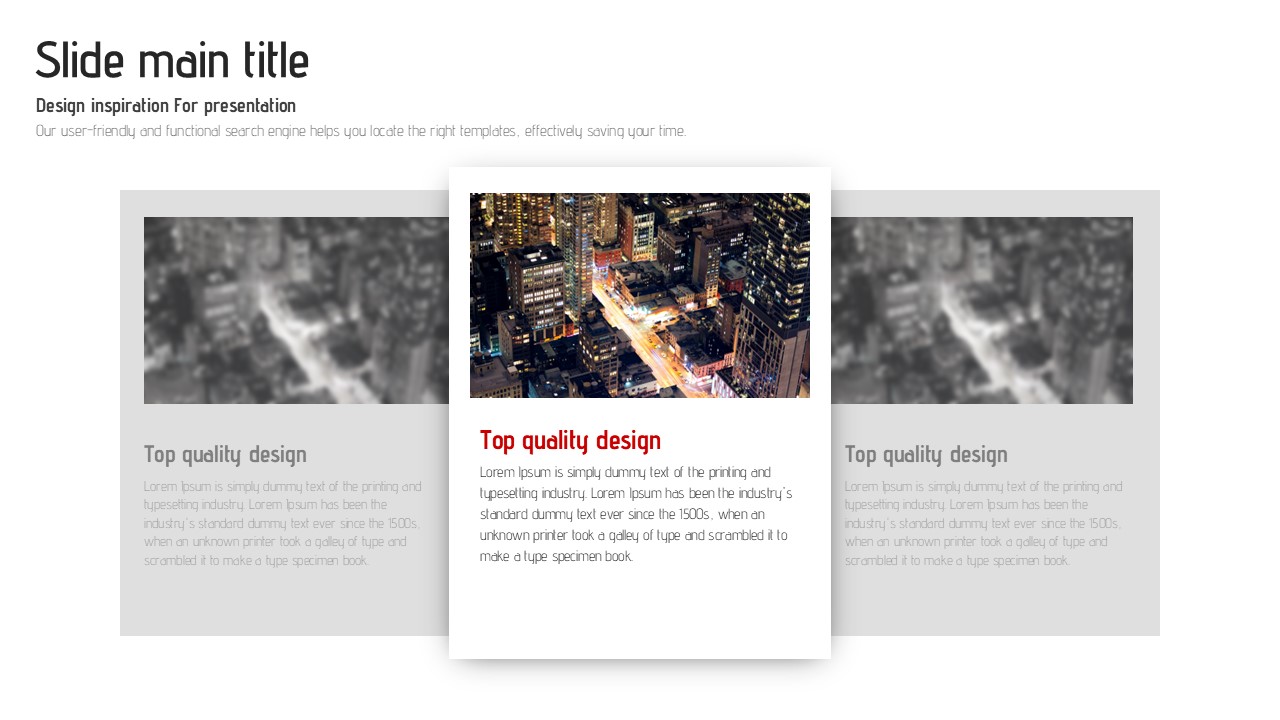
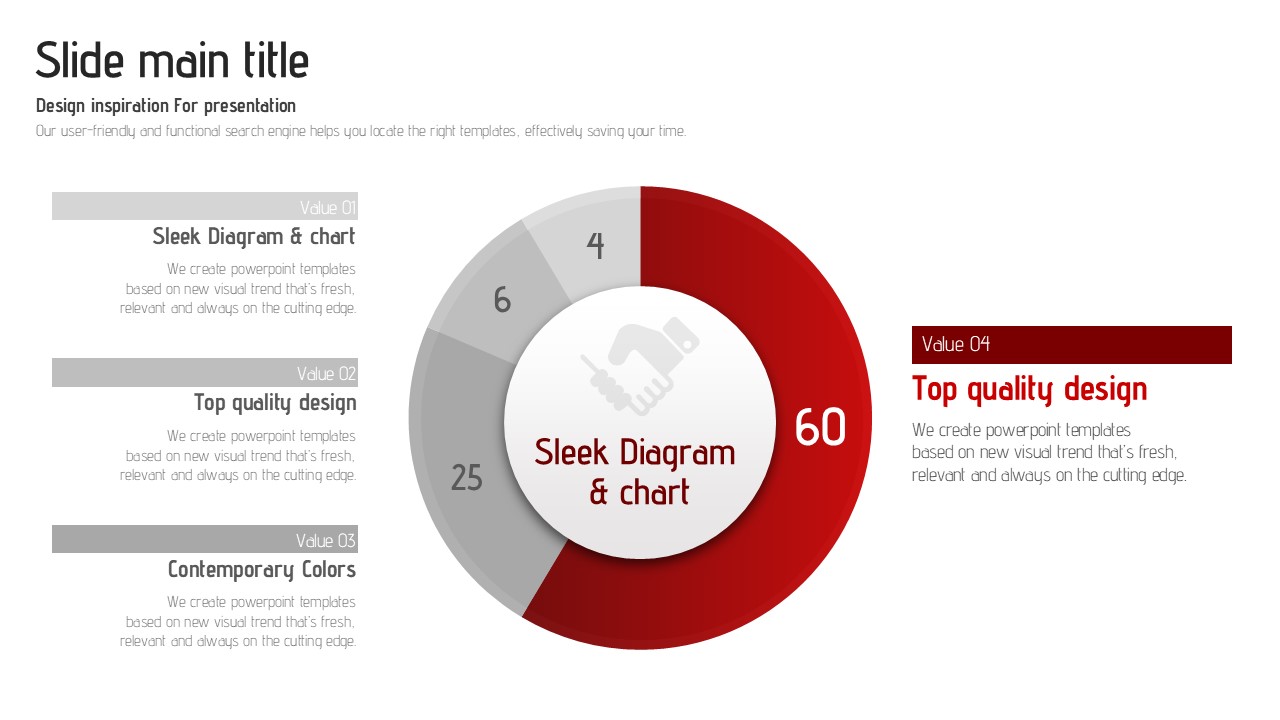
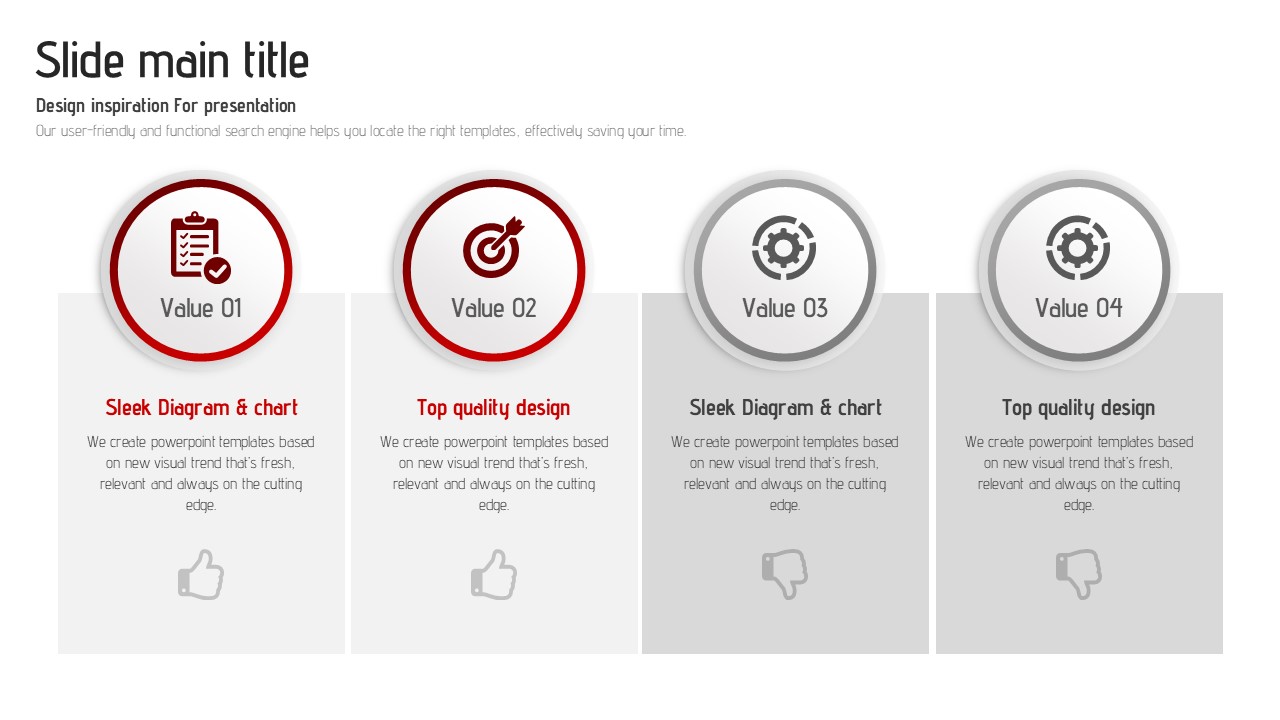
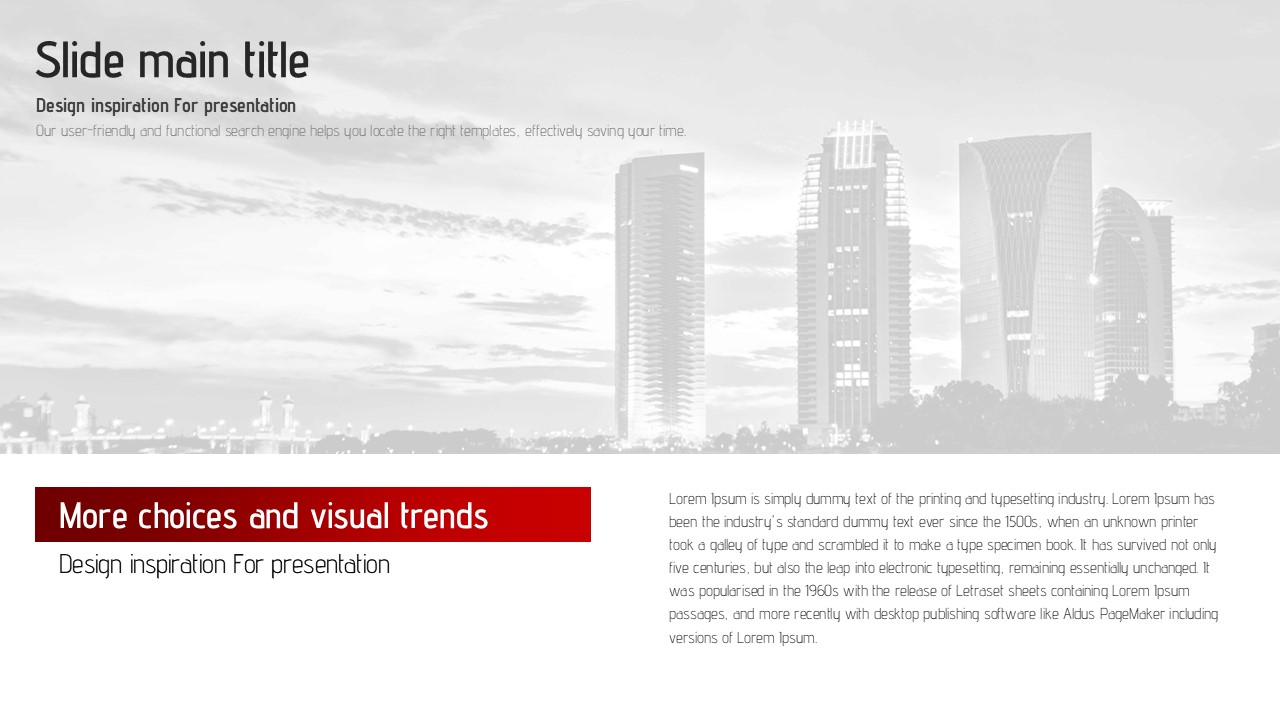
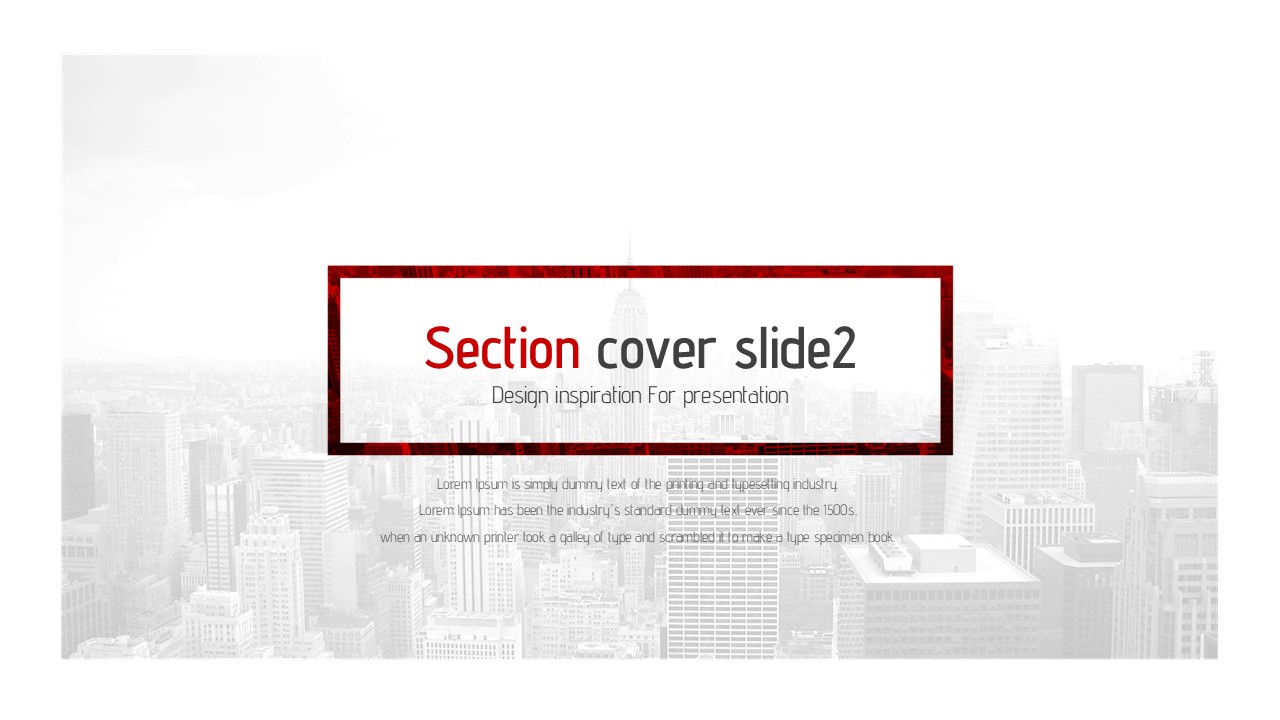
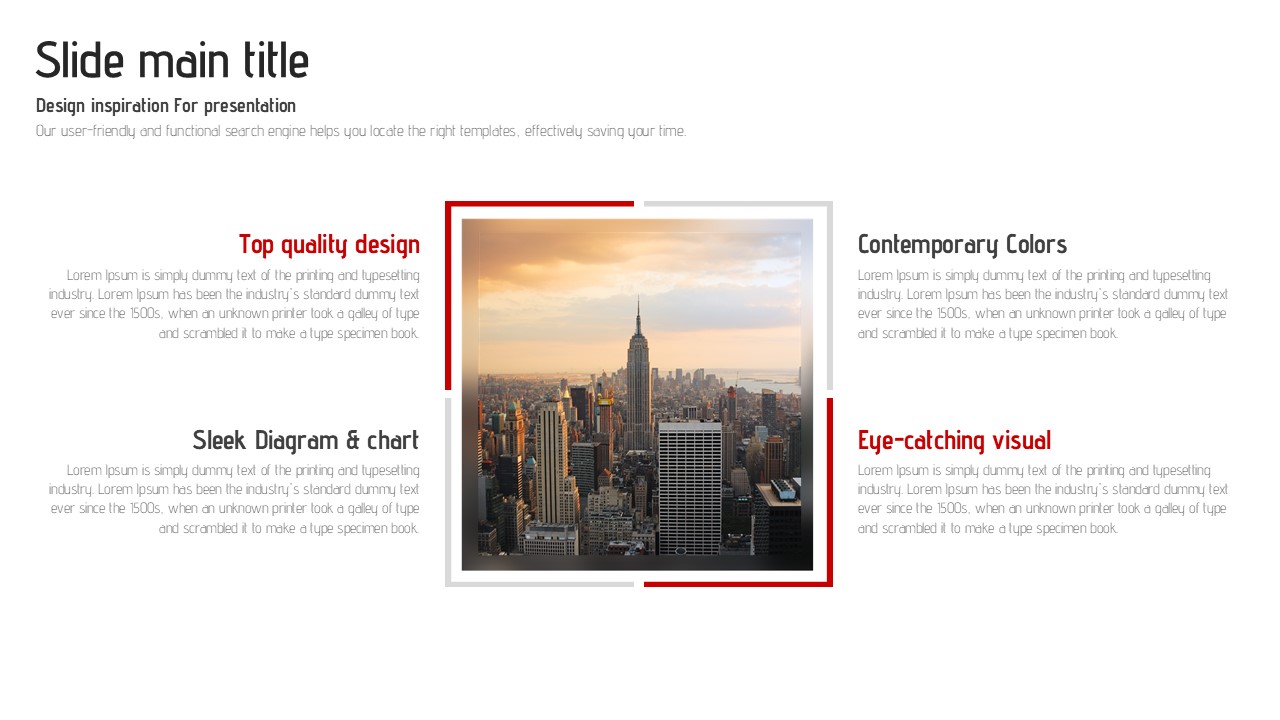
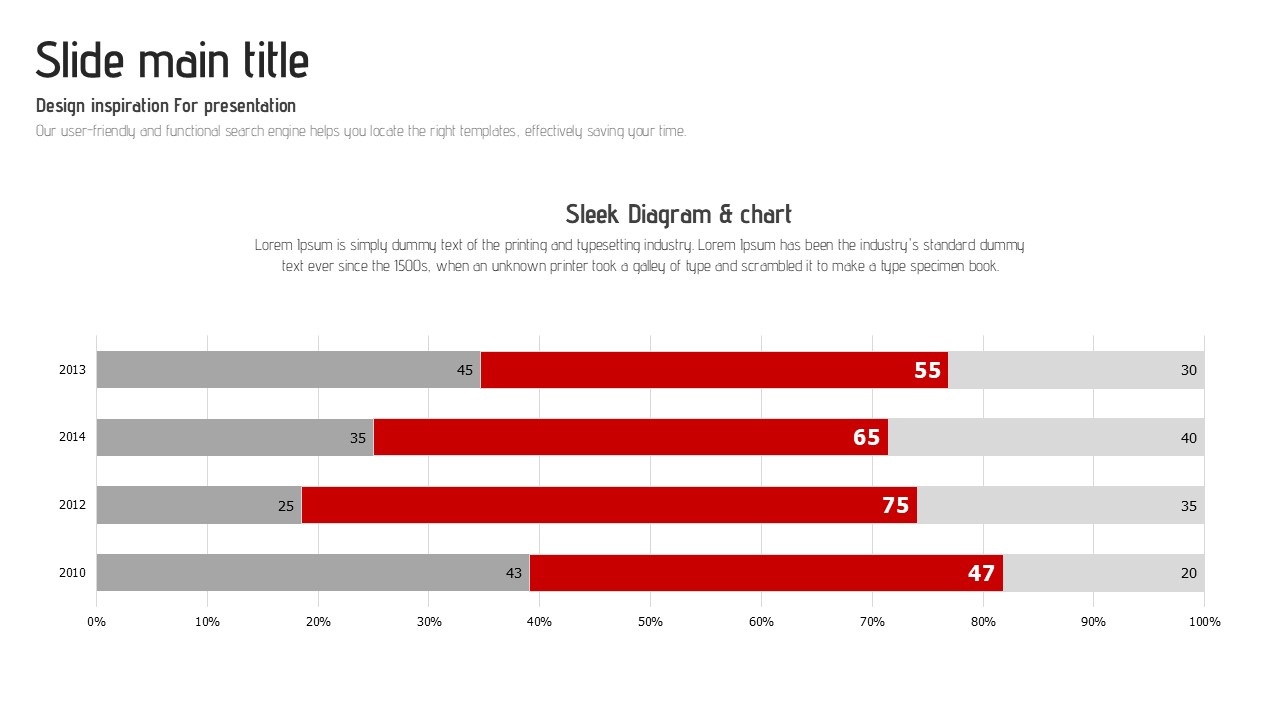
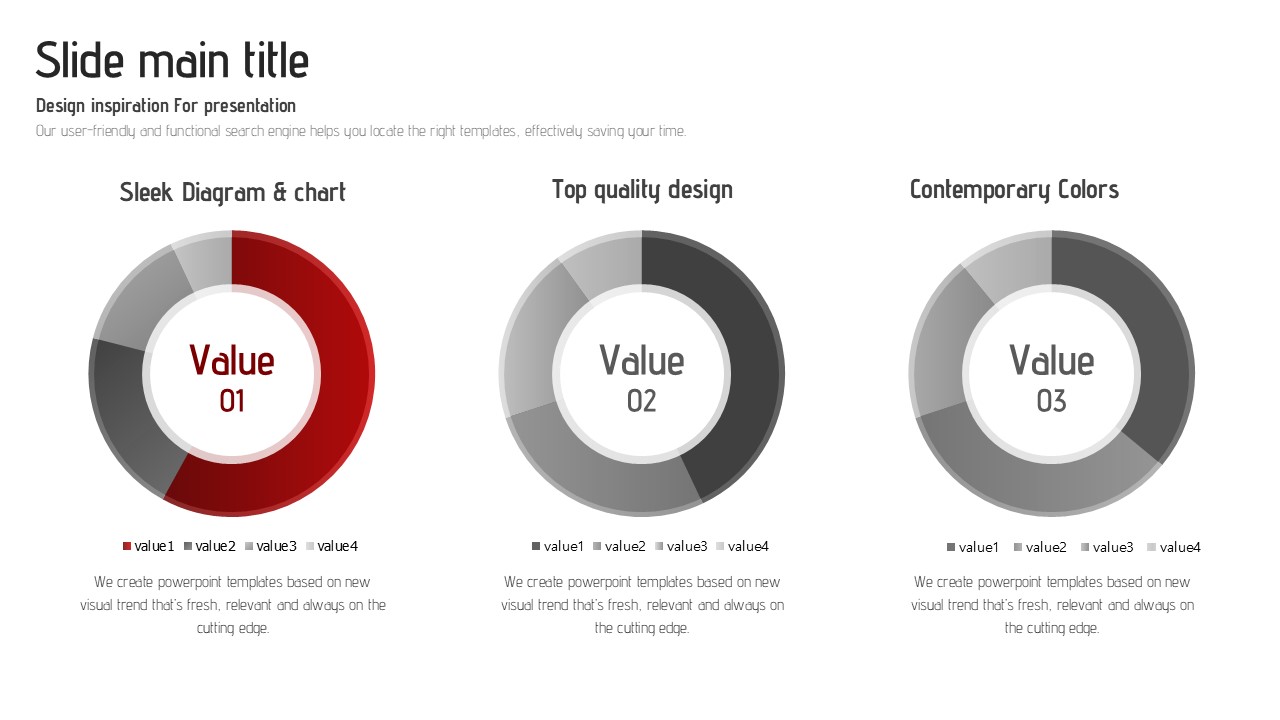
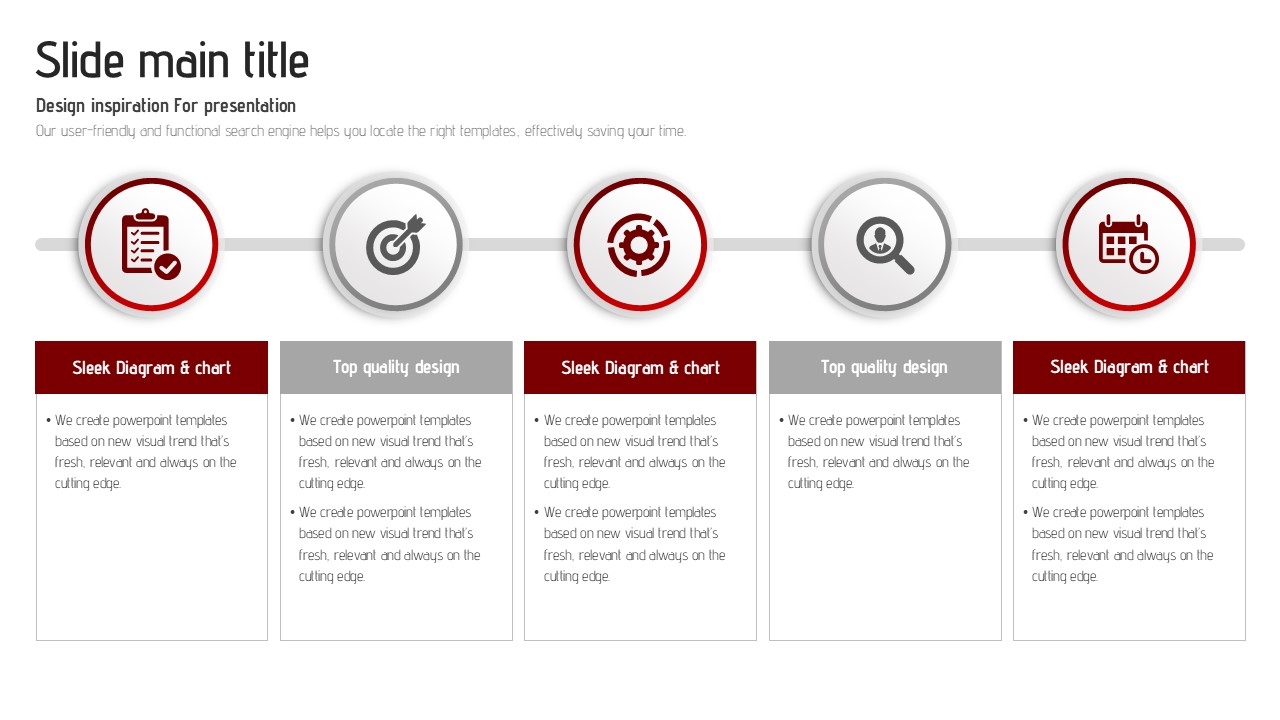
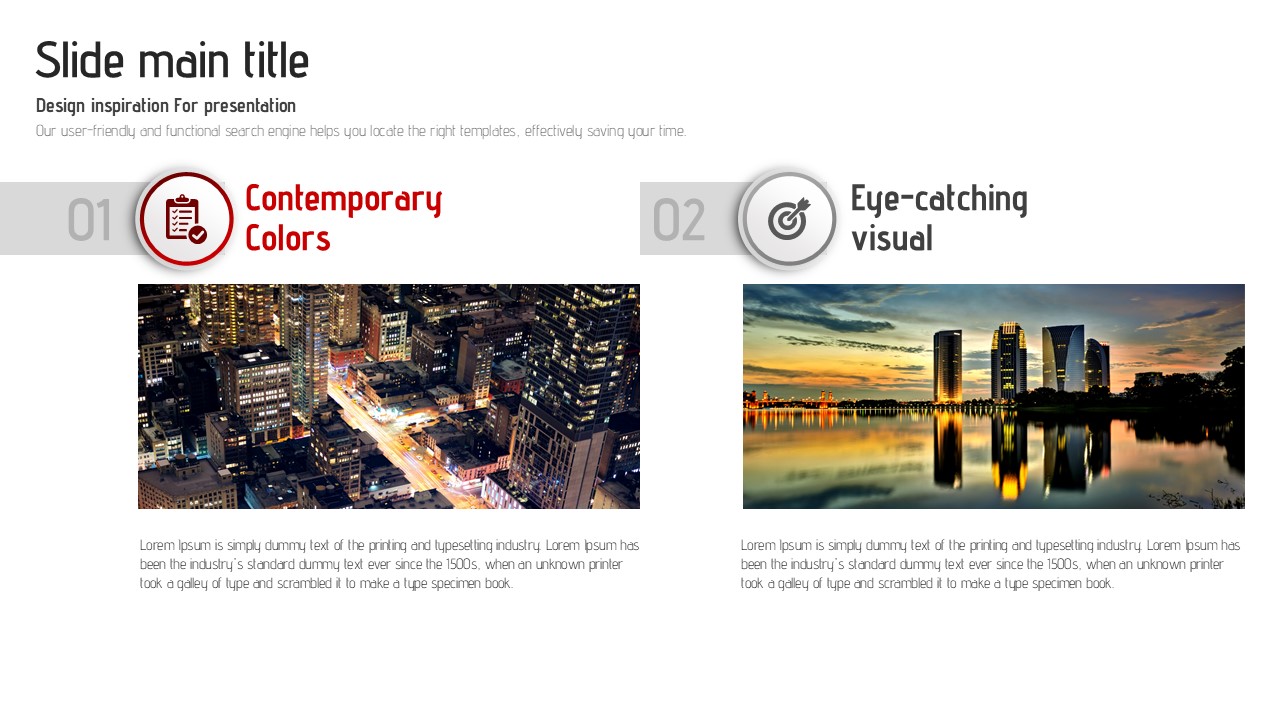
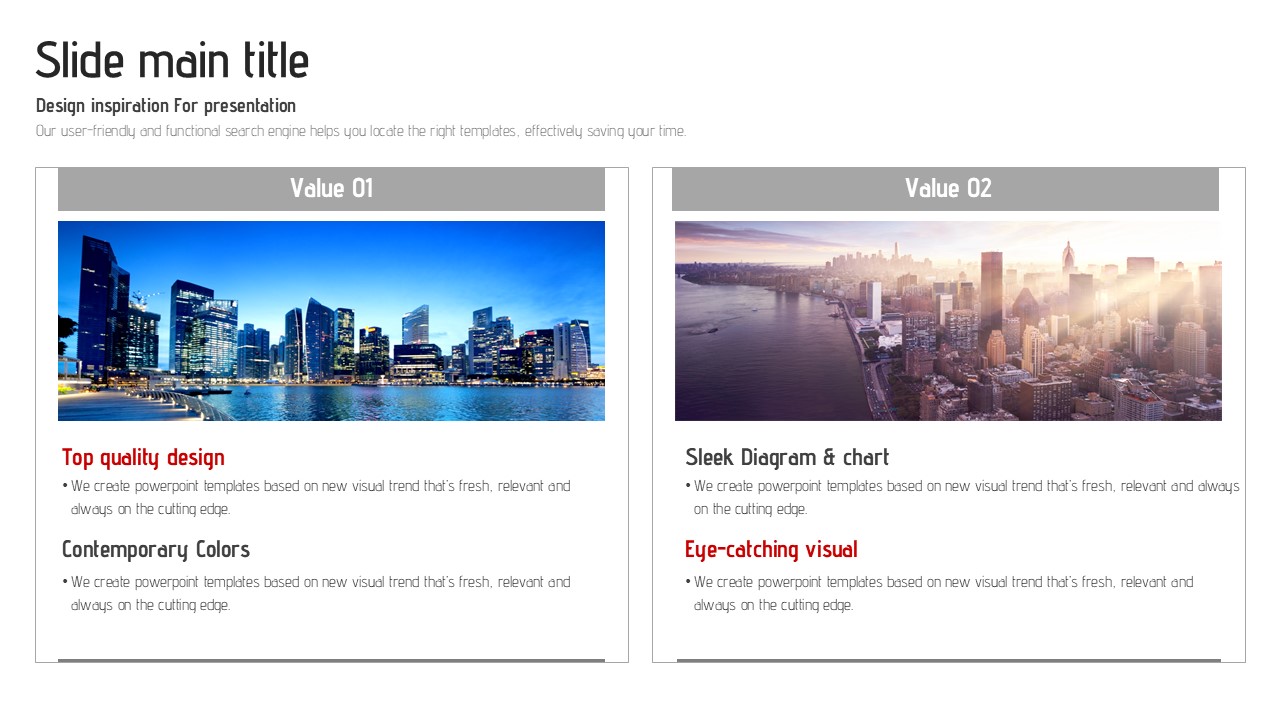
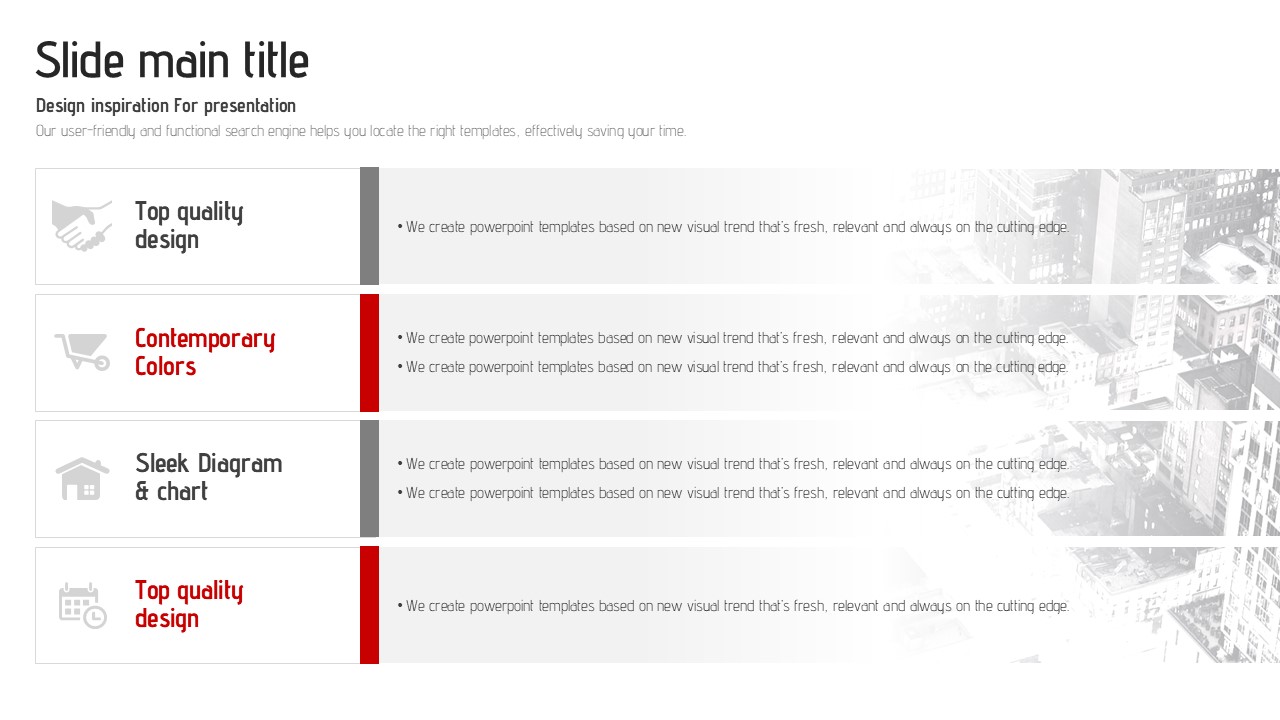
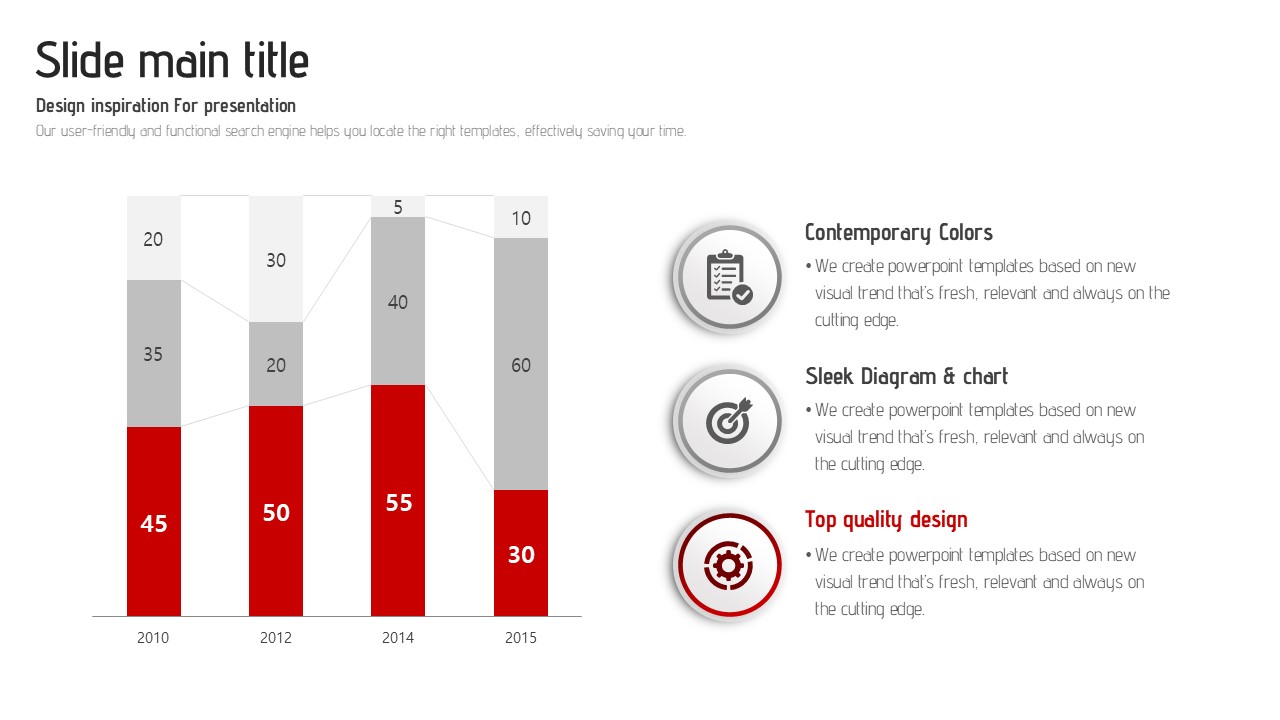
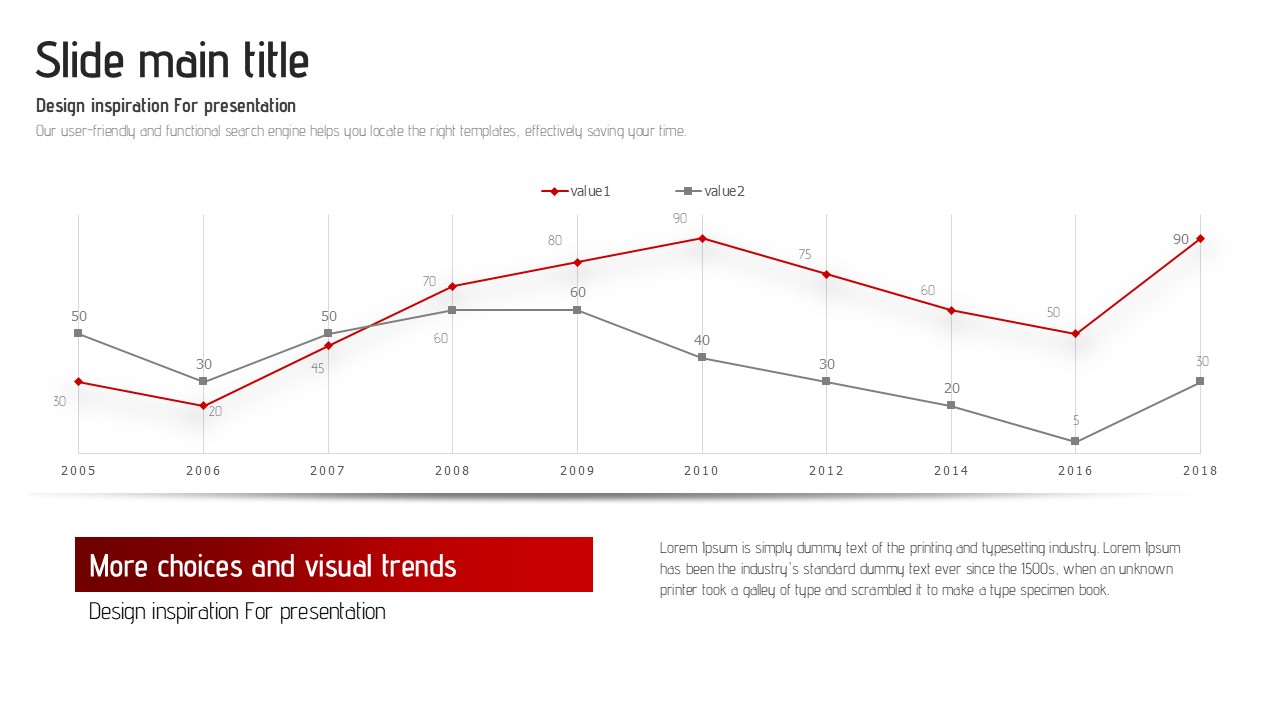
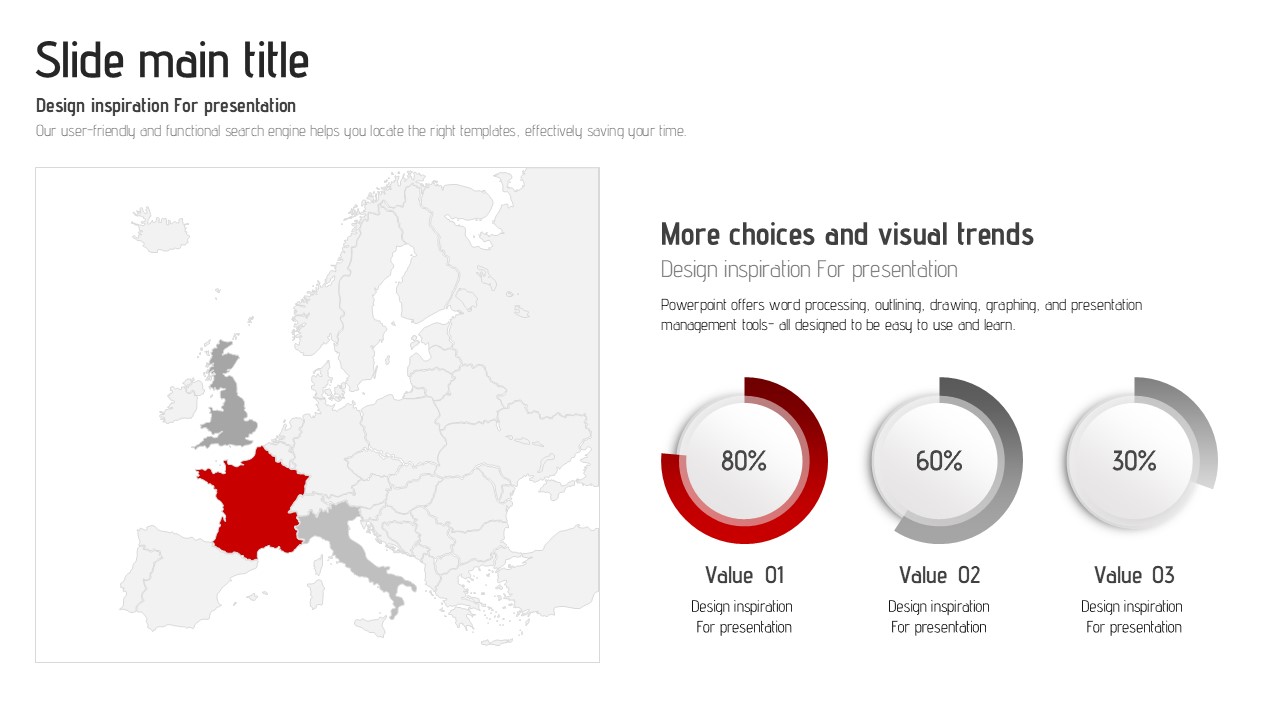
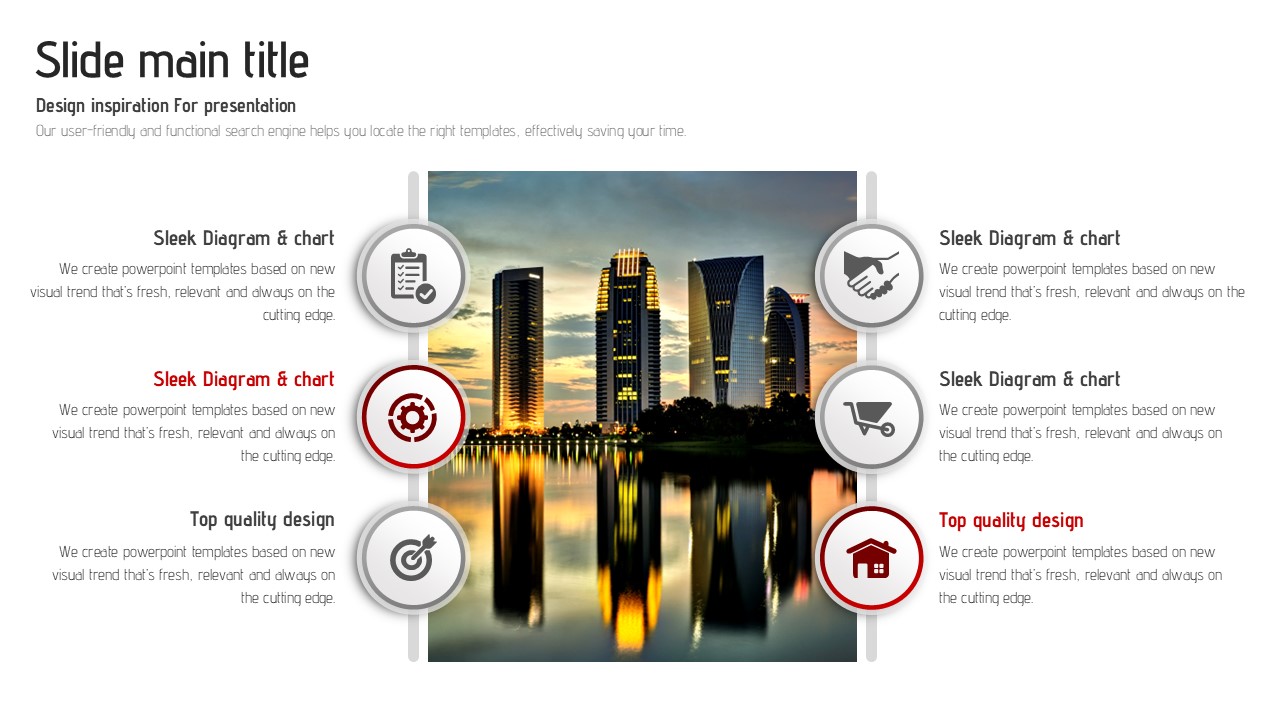
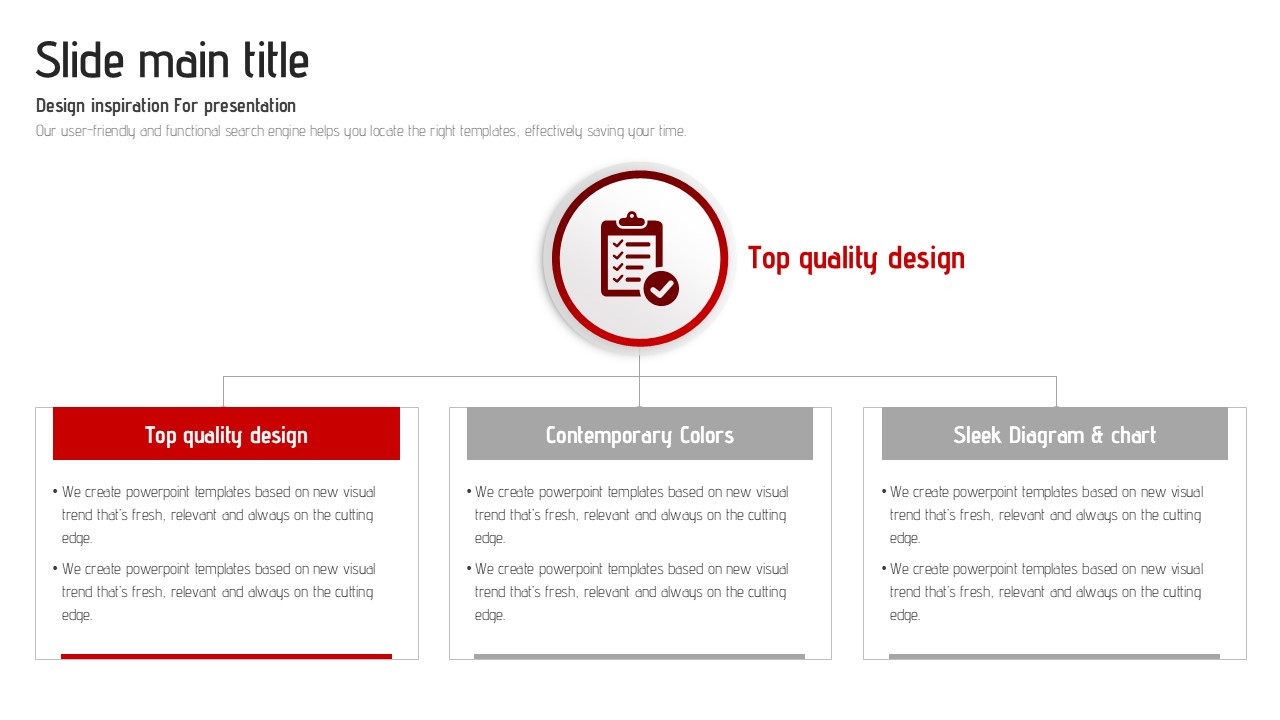
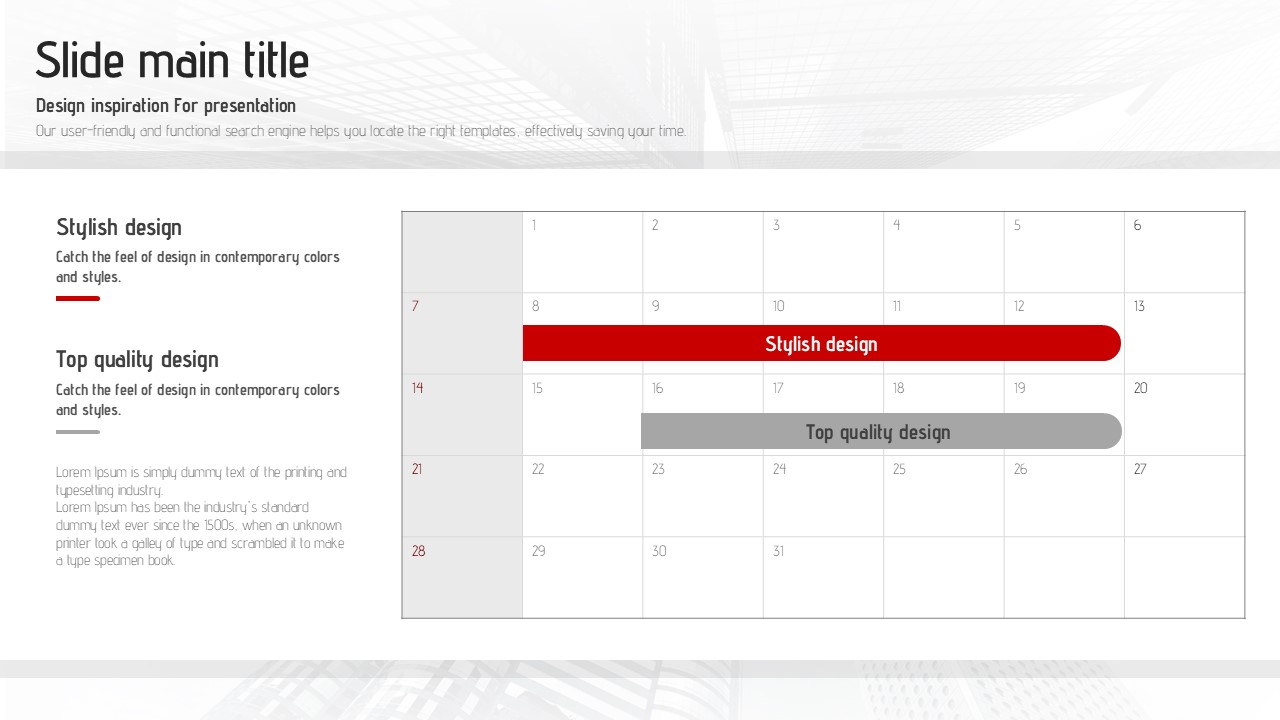
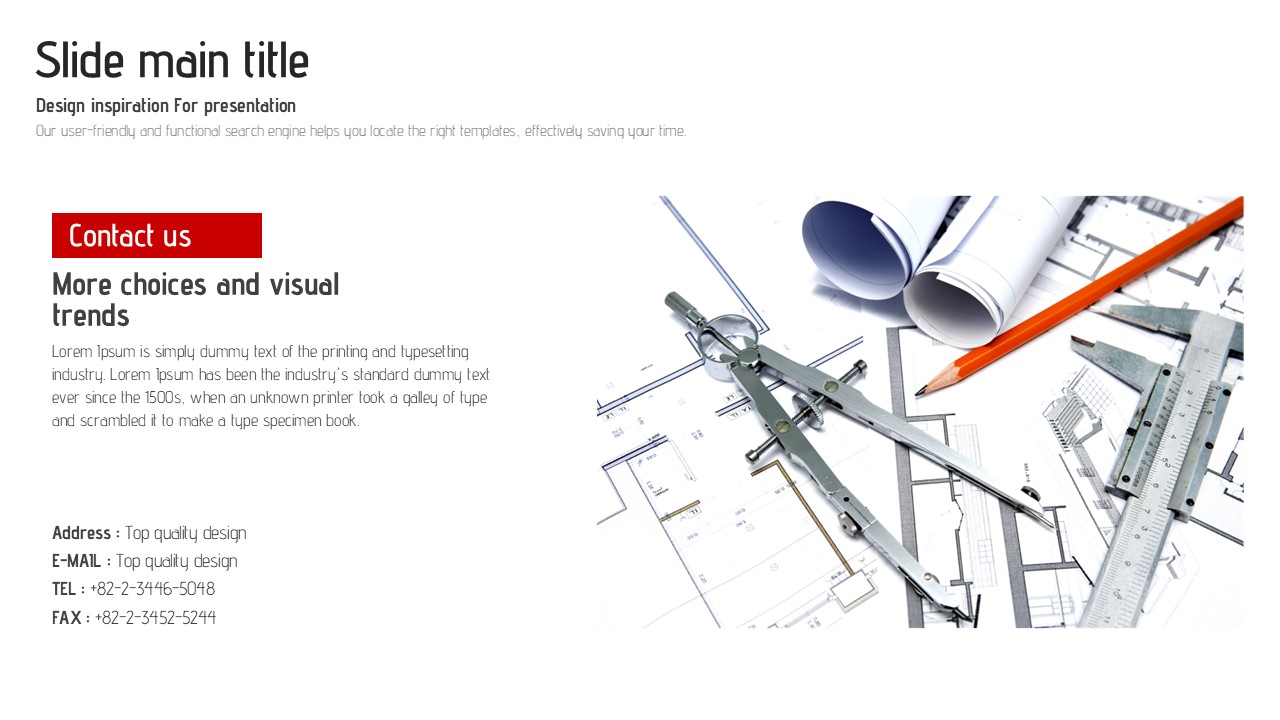
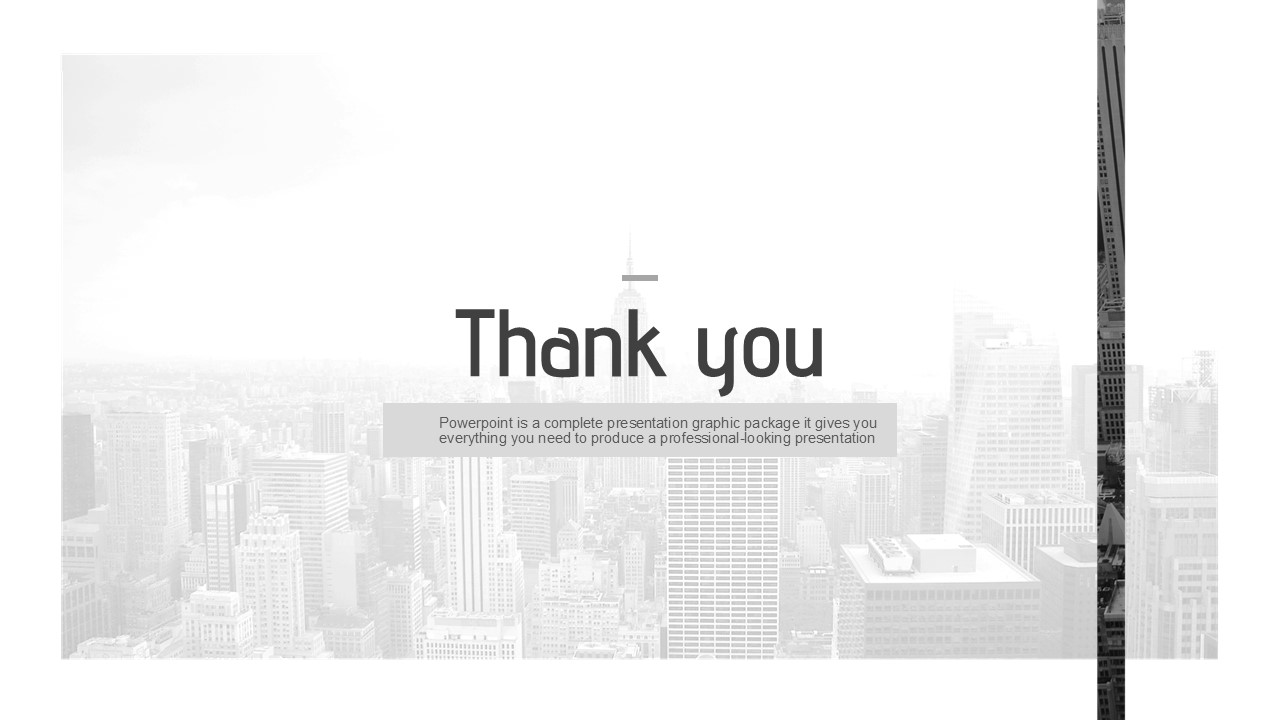
A clean, minimal business PowerPoint template featuring a white background with dark-red accent colors and city skyline imagery. The 30-slide set uses a two-column grid layout to balance text, charts, and icons effectively across a wide range of business presentations. Slides include donut charts, bar charts, circular icon cards (Value 01–04), and text-plus-image split layouts — all the formats you need for corporate pitches, service introductions, and team presentations. Simply replace the placeholder text and data to produce polished, professional slides without any additional design work. Delivered in fully editable PPTX format, compatible with all major versions of PowerPoint.

Usage Points

  • Main Usage

    Designed for corporate pitches, service introductions, team presentations, and general business meetings where a professional yet visually impactful slide deck is required. The white-and-red color scheme delivers a confident, authoritative impression across industries.

  • How to Use

    Download the PPTX file, open it in PowerPoint, and replace the placeholder text, images, and chart data with your own content. Rearrange the 30 slides as needed — choose from donut charts, bar charts, icon card grids, or text-image split layouts to match your presentation flow.

  • Recommended For

    Best suited for business professionals, marketers, startup founders, and consultants who regularly prepare corporate presentations. As a General-category template, it adapts easily to any industry — from finance and consulting to tech and services.

  • Slide Structure

    The 30-slide deck includes a title slide with city skyline background, two-column body slides with donut and bar charts, a four-panel icon card slide (Value 01–04), text-plus-image split slides with red banner accents, and a closing Thank You slide.

View Individual Slides in This Template

- Origami Presentation Template Cover Slide

- Origami Presentation Template Section Table – Showcase Financial Performance

- Origami Vision Diagram3 – Business Strategy

- Donut Chart PPT Template for Market Overview

- Visualizing Operational Plans with Vision Diagrams – Effective Product Strategy

- Utilizing Vision Image and Text in Origami Template

- Origami Presentation Template Section Cover Slide

- Origami Presentation Template Section Diagram – Perfect for Business Introduction

- Bar Chart for Market Analysis Visualization – Innovation and Growth

- Origami Vision Donut Chart 2 – Market Analysis and Performance

- Origami Vision Flow Diagram Template

- Origami Presentation Template Cover – Attractive Table of Contents Design

- Presentation Template Visualizing Business Introduction with Vision Image & Text

- Origami Template for Vision Delivery – Innovative Marketing Strategy

- Origami Presentation Template Diagram6 – Marketing Goals and Strategies

- Origami Presentation Template Section Vertical Bar Graph – Strategic Business Drive

- Origami Presentation Template Section Line Graph – Market and Performance Analysis

- Origami Presentation Template – Market Insights and Vision Map Analysis

- Origami Presentation Template Section Diagram7 – A Strategy for Business Approach and Growth

- Origami Vision Tree Diagram – Business Management and Action Plan

- Origami Presentation Template Section Schedule – Business Progress Management

- Company Profile Presentation Template - Contact Section

- Origami Presentation Template Section Dividing Slide – Design Inspiration

- Origami Presentation Template Section Ending Cover – Creative and Hopeful Closure

- Origami Presentation Template – Capturing Vision and Core Values

- Origami Presentation Template for Company Introduction

- Origami Presentation Template for Vision Team Introduction

- Business Introduction using Vision Diagram – Effective Data Visualization

- Origami Presentation Template Vision Diagram – Product and Program Introduction

- Vertical Bar Graph for Vision Growth – Business Development Strategy

Add to Collection

  • No collections created.

TOP