Business Introduction using Vision Diagram – Effective Data Visualization
RJ0200042_7
- Last Update 04/10/2025
- File Size 0.5MB
- # of Slides 2
- File Format PPTX
- Slide Ratio 16:9
- Color
Keywords
- #Content-Based Slides
- #Design-Based Slides
- #Company Introduction
- #Business Introduction
- #Diagram
- #Company Overview
- #Business Areas
- #Cluster
- #Closed Cluster Diagram
- #16:9
- #closed cluster diagram PowerPoint
- #3-node circular diagram template
- #business relationship diagram slide
- #cluster diagram PPT template
- #organizational structure diagram PowerPoint
About the Product
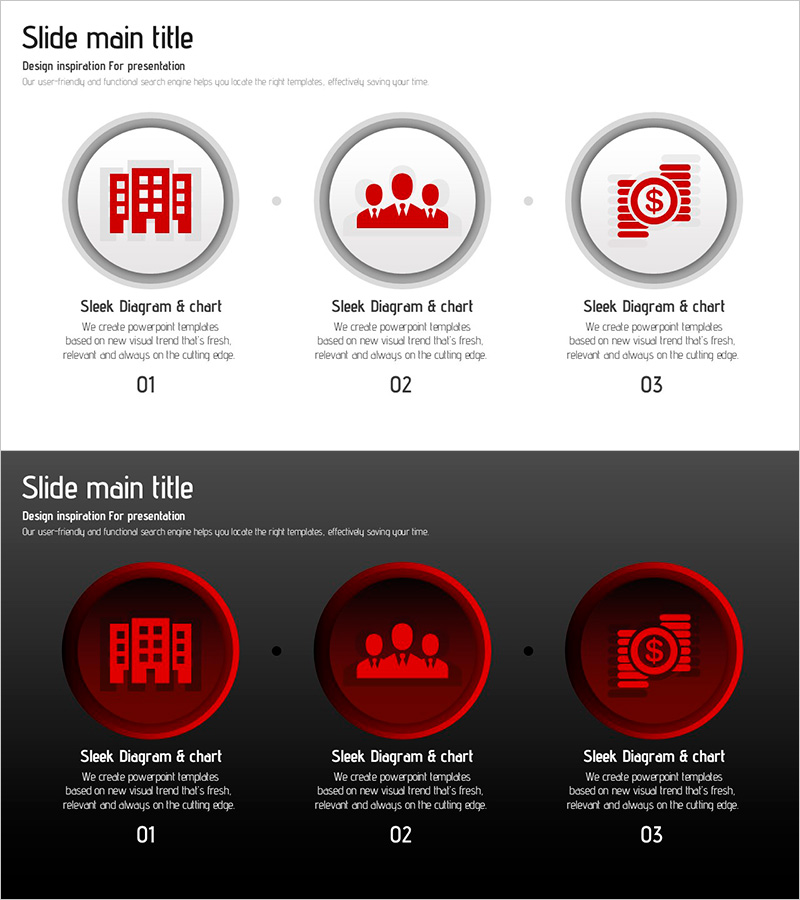
A closed cluster diagram PowerPoint slide featuring three circular nodes arranged horizontally with gray borders. Each node contains a red icon (building, team, finance) representing key business elements and their interconnected relationships. Two design versions are provided: a light background layout and a dark background layout for versatile presentation contexts. Text description areas below each node enable immediate customization for corporate introductions, business structure explanations, organizational charts, and strategic relationship mapping. Delivered in 16:9 PPTX format with full editing capability.
Usage Points
-
Main Usage
Visualizes interconnected business elements (organization, team, finance) and their relationships within an integrated system. The closed circular arrangement emphasizes cyclical or unified structures, making it ideal for corporate introductions, business model explanations, and organizational hierarchy presentations.
-
How to Use
Replace icons within each circular node or edit text labels to match your specific business elements. Use the light background version for standard presentations and the dark version for premium or formal contexts. Adjust connecting lines between nodes to represent relationship strength or dependency levels as needed.
-
Recommended For
Executives, planning teams, marketing departments, and sales teams explaining corporate strategy, business structure, and organizational relationships. Suitable for investor presentations, partnership proposals, internal training materials, consulting reports, and strategic business communications.
-
Slide Structure
Two-slide layout. First slide features a light background (white/light gray) with three gray-bordered circles arranged horizontally, each containing a red icon (building, team, finance). Second slide uses a dark background (black/dark gray) with the same structure in red circles. Text input areas positioned below each node for customization.
Related Products
-

Data Analytics Business Company Overview Slide – Cluster Diagram for Business Areas
#Company Introduction #Business Introduction #Diagram
-

Business Area Cluster Closure – Clear Business Introduction
#Company Introduction #Business Introduction #Diagram
-

Company Overview of Eco-Friendly Enterprises PPT – Sustainable Vision
#Company Introduction #Diagram #Company Overview
-

Typographic Wide Template Diagram – Company and Service Overview
#Company Introduction #Product/Service Introduction #Diagram
