Origami Presentation Template Section Table – Showcase Financial Performance
RJ0200042_10
- Last Update 04/09/2025
- File Size 0.4MB
- # of Slides 2
- File Format PPTX
- Slide Ratio 16:9
- Color
Keywords
- #Content-Based Slides
- #Design-Based Slides
- #Financial Plans and Performance
- #Diagram
- #Cash Flow Statement
- #Sales and Revenue
- #Table
- #Standard Table
- #16:9
- #financial table PowerPoint
- #performance comparison slide
- #data table PPT
- #financial report template
- #revenue analysis slide
- #table diagram PowerPoint
- #financial metrics presentation
About the Product
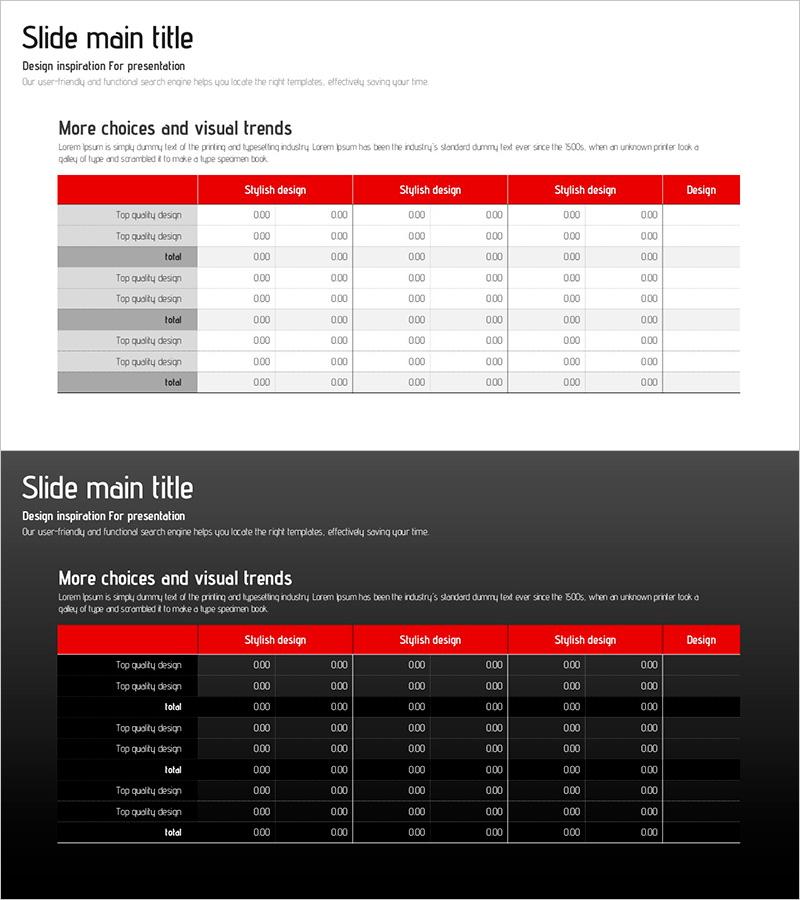
A table-based PowerPoint slide designed to clearly compare and organize financial data and performance metrics. Featuring a red header row and alternating white and gray data rows in a 2-column structure, numerical comparisons are intuitive and easy to follow. Ideal for financial planning, revenue reporting, cash flow analysis, and quantitative data presentations. Available in 16:9 PPTX format for seamless editing and immediate use in corporate reports, investor presentations, and financial analysis meetings.
Usage Points
-
Main Usage
Visualize quantitative financial data, performance indicators, and revenue metrics in a structured table format to enhance audience comprehension. The red header emphasizes key items while row separation maximizes data readability and visual hierarchy.
-
How to Use
Apply to corporate financial reports, quarterly earnings presentations, investor relations meetings, and financial analysis decks. Input revenue, expenses, cash flow, ROI, and other metrics by row. Fully editable for immediate deployment in professional settings.
-
Recommended For
CFOs, finance managers, executives, and investor relations professionals presenting financial performance. Suitable for board meetings, shareholder conferences, banking negotiations, consulting reports, and internal financial reviews requiring credible data visualization.
-
Slide Structure
2-slide deck. Each slide contains a red header row (4–5 columns) and 8–10 data rows in alternating white and gray. Clear row dividers and color contrast distinguish items for easy metric comparison and numerical analysis.
Related Products
-

Spring Background Table – Visualizing Financial Performance!
#Financial Plans and Performance #Diagram #Cash Flow Statement
-

Key Metrics – Effective Financial Analysis Slide
#Financial Plans and Performance #Diagram #Cash Flow Statement
-

Annual Sales and Profit Analysis Table – Key to Financial Planning
#Financial Plans and Performance #Diagram #Cash Flow Statement
-

Green Orange Table Slide – Financial Insights at a Glance
#Financial Plans and Performance #Diagram #Cash Flow Statement
