Origami Presentation Template Section Vertical Bar Graph – Strategic Business Drive
RJ0200042_23
- Last Update 04/10/2025
- File Size 0.5MB
- # of Slides 2
- File Format PPTX
- Slide Ratio 16:9
- Color
Keywords
- #Content-Based Slides
- #Design-Based Slides
- #Business Strategy
- #Market and Competitor Analysis
- #Graph
- #Financial Outlook & Expected Impact
- #Market Status
- #Column
- #Segmented Column
- #16:9
- #vertical bar chart PowerPoint
- #bar graph presentation slide
- #year-over-year comparison chart
- #business data visualization
- #financial chart template
About the Product
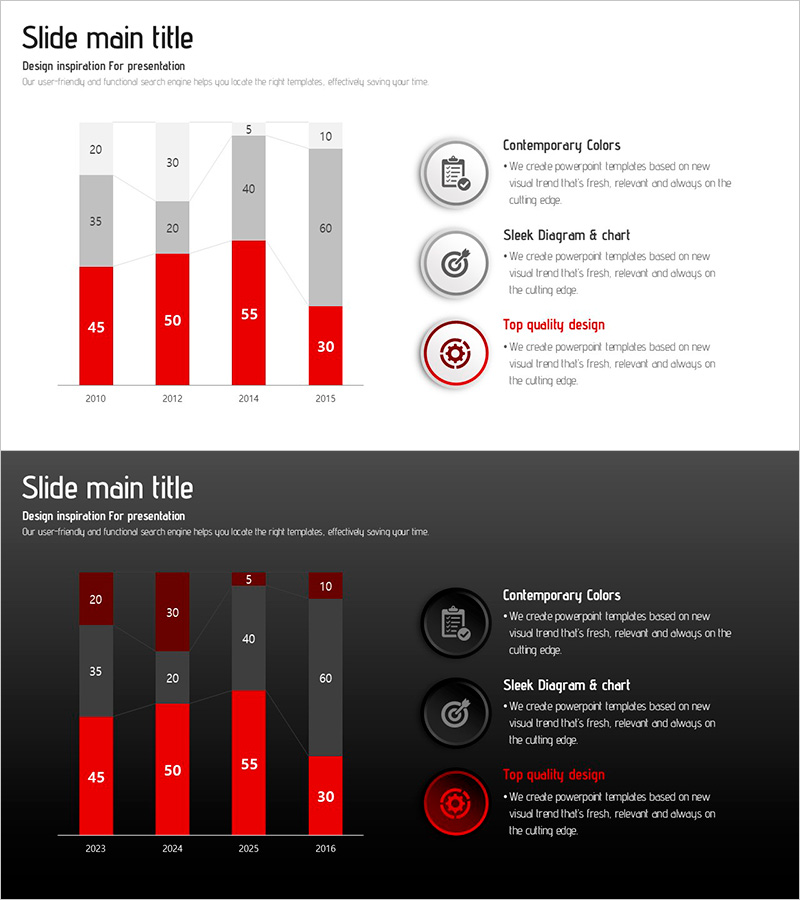
A vertical bar chart PowerPoint slide designed to clearly display year-over-year data trends across multiple series. Available in two versions—white background and dark background—with red and gray dual-tone colors to emphasize key metrics. The slide effectively compares four data series per year, making it ideal for visualizing business performance, sales trends, market share evolution, and other quantitative business data. Three icon-based explanations on the right side support chart interpretation. This 16:9 widescreen 2-slide set is fully editable and ready to use.
Usage Points
-
Main Usage
This slide presents multi-series quantitative data across time periods using vertical bar charts. It is ideal for communicating business performance trends, sales comparisons, market share changes, departmental performance metrics, and other data-driven insights in executive presentations and strategic reviews.
-
How to Use
Simply update the chart values and labels to match your presentation data. Use the white background version for bright presentation environments and the dark version for dimly lit rooms or projector displays. Customize the icon descriptions to highlight key analytical points relevant to your data.
-
Recommended For
Recommended for quarterly and annual performance reports, marketing effectiveness reviews, financial status presentations, business planning sessions, and strategic analysis meetings. Ideal for CFOs, marketing managers, project managers, sales leaders, and business analysts presenting data-driven insights.
-
Slide Structure
2-slide set in 16:9 widescreen format: Slide 1 features a white background with a 4-series vertical bar chart (2010–2015, four bars per year) and three icon-based explanations on the right. Slide 2 mirrors the layout with a dark background showing 2023–2026 data. All elements are fully editable.
Related Products
-

Profitability Analysis Segmentation Graph – Market Status and Strategy
#Business Strategy #Market and Competitor Analysis #Graph
-

Profitability Outlook Breakdown Graph – Future Predictions and Strategies
#Business Strategy #Market and Competitor Analysis #Graph
-

Trade Business Analysis Graph – Visualizing Market Status
#Market and Competitor Analysis #Graph #Market Status
-

Blue Pink Market Analysis Segmented Vertical Bar Graph
#Market and Competitor Analysis #Graph #Market Status
