Bar Chart for Market Analysis Visualization – Innovation and Growth
RJ0200042_17
- Last Update 04/10/2025
- File Size 0.5MB
- # of Slides 2
- File Format PPTX
- Slide Ratio 16:9
- Color
Keywords
- #Content-Based Slides
- #Design-Based Slides
- #Business Strategy
- #Market and Competitor Analysis
- #Graph
- #Market Status
- #Horizontal Bar
- #Segmented Horizontal Bar
- #Project Progress
- #16:9
- #horizontal bar chart PowerPoint
- #bar graph presentation slide
- #market analysis chart
- #business progress visualization
- #year-over-year comparison
About the Product
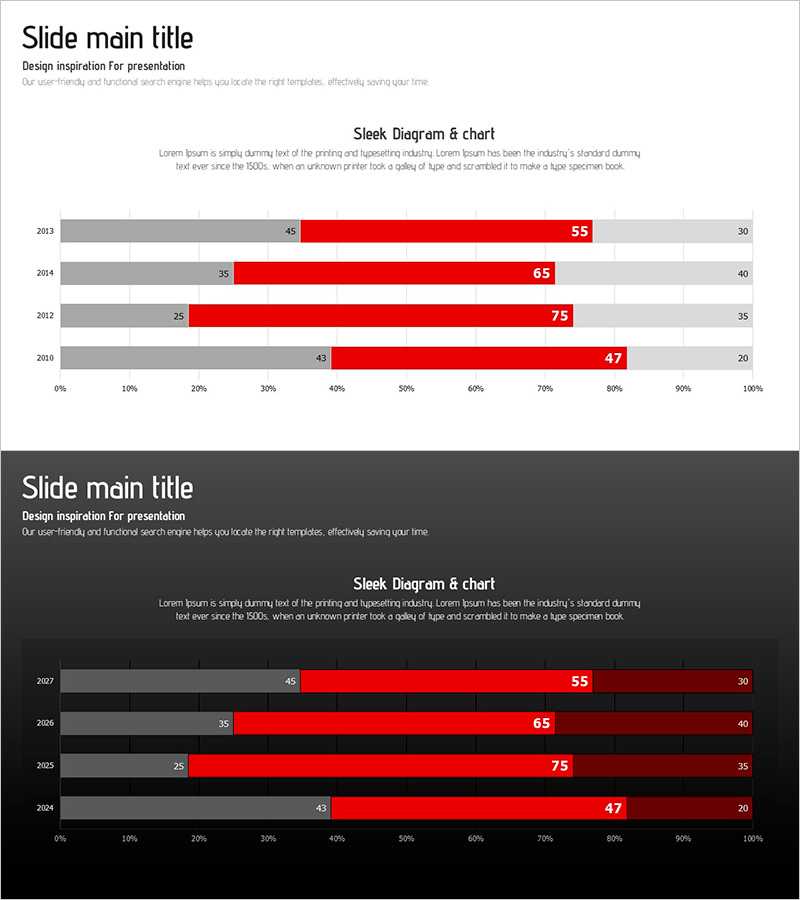
A horizontal bar chart PowerPoint slide designed to visualize business progress and market analysis results across four years (2013–2016). The slide features three data series represented by distinct colors (left gray, center red, right gray) enabling side-by-side comparison of multiple metrics. Two design versions are included: a light background layout for internal meetings and a dark background layout for executive presentations. Each bar displays numeric labels for precise data communication, making it ideal for competitive analysis, growth rate trends, and market share evolution. The 16:9 widescreen format with 2 slides allows immediate editing and deployment.
Usage Points
-
Main Usage
Compares quantitative data across years and categories using horizontal bars. Effectively communicates business progress, market analysis outcomes, competitive performance benchmarks, and growth rate trajectories. The three-series format enables simultaneous representation of complex metrics and multi-dimensional analysis.
-
How to Use
Replace bar lengths and numeric values with your own data for each year row. Use the light background version for internal team meetings and weekly reviews; deploy the dark background version for C-suite briefings and external investor presentations. Colors and labels are fully editable to match corporate branding guidelines.
-
Recommended For
Executives, business managers, and marketing teams presenting quarterly or annual performance reports. Ideal for investor pitch decks demonstrating business growth trajectories and competitive positioning in strategy sessions. Finance, sales, and planning departments benefit from this quantitative data presentation format.
-
Slide Structure
Two-slide set. Slide 1: light background (light gray and white) with 4 year rows and 3 data series bars (left gray: 45, 35, 25, 43; center red: 55, 65, 75, 47; right gray: 30, 40, 35, 20). Slide 2: identical data structure on dark background (charcoal and black). Horizontal axis 0–100%, numeric labels on each bar.
Related Products
-

Bar Graph Analysis for Business Strategy – Market Diagnosis
#Business Strategy #Market and Competitor Analysis #Graph
-

Horizontal Bar Segmentation Graph – Visualizing Business Strategy
#Business Strategy #Market and Competitor Analysis #Graph
-

Market and Business Trends Visualization Graph
#Business Introduction #Market and Competitor Analysis #Graph
-

Modern Wide PowerPoint Template Segmentation Horizontal Bar Chart – Market and Performance Analysis
#Business Strategy #Market and Competitor Analysis #Graph
