Donut Chart PPT Template for Market Overview
RJ0200042_12
- Last Update 04/09/2025
- File Size 0.5MB
- # of Slides 2
- File Format PPTX
- Slide Ratio 16:9
- Color
Keywords
About the Product
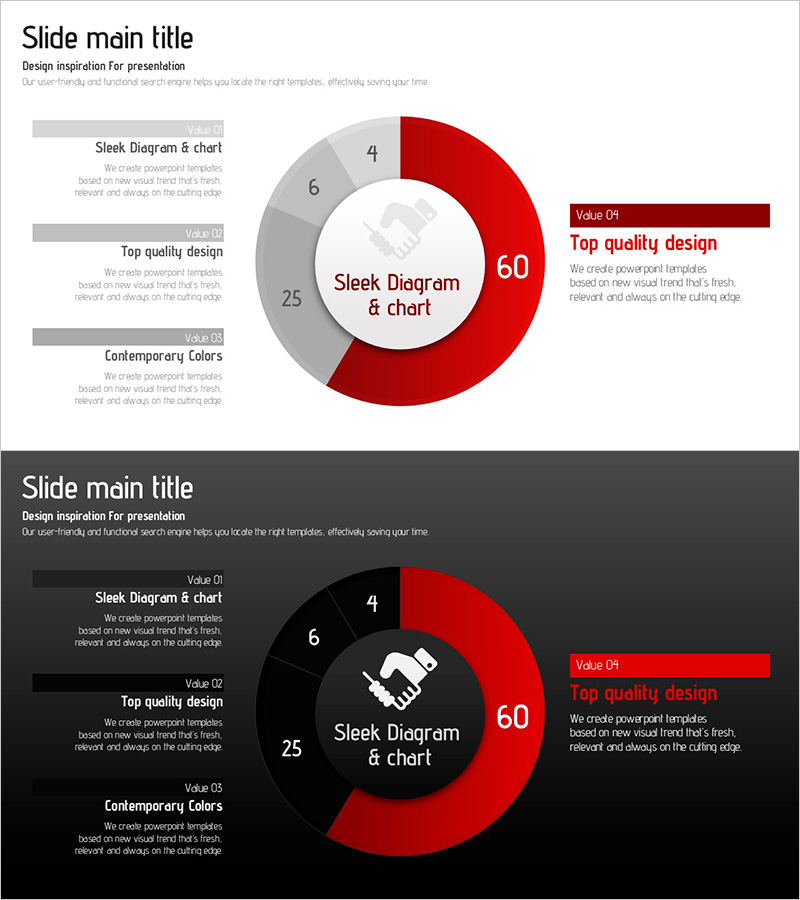
A professional donut chart PowerPoint slide for presenting market share, revenue composition, and proportional data with visual clarity. The design features a central circular area highlighting the key metric (60), surrounded by a segmented outer ring divided into 4 sections displaying individual percentages. The red and gray color scheme emphasizes data hierarchy, while left-aligned text boxes provide detailed descriptions for each segment. Two background versions—white and dark gray—are included for flexible presentation contexts. Fully editable PPTX format allows instant customization of values, labels, and content to suit various business analytics and reporting scenarios.
Usage Points
-
Main Usage
Effectively communicates proportional relationships such as market share, revenue breakdown, customer distribution, and product composition. The central metric draws immediate attention, while color-differentiated segments enable quick comprehension of relative importance across categories.
-
How to Use
Insert into business reports, marketing presentations, quarterly performance reviews, and investor pitch decks within the data analysis section. Replace the central figure with your total metric and update each segment with corresponding category values. Modify left-side labels and descriptions to align with your presentation narrative.
-
Recommended For
Finance, marketing, sales, and strategy professionals presenting periodic reports or executive briefings. Ideal for market analysis, customer segmentation, product portfolio composition, budget allocation, and competitive positioning discussions.
-
Slide Structure
2-slide set. Each slide displays a donut chart with a central metric (60) and 4 outer ring segments (25, 6, 4, remainder) representing proportional data. Left side contains 3 labeled text boxes with descriptions; right side features a 'Top quality design' accent box. Available in white and dark gray background versions.
Related Products
-

Management System Donut Chart Slide – Market Share and Status
#Market and Competitor Analysis #Graph #Market Status
-

Guide to Admission Evaluation Criteria with Donut Chart
#Market and Competitor Analysis #Graph #Market Status
-

Visualizing Value Ratios with Pie Charts – Essential Presentation Template
#Market and Competitor Analysis #Diagram #Graph
-

Visualizing Fish Market Share with Doughnut Chart – Vitality of the Ocean
#Market and Competitor Analysis #Graph #Market Status
