Origami Presentation Template Section Schedule – Business Progress Management
RJ0200042_28
- Last Update 04/10/2025
- File Size 2.7MB
- # of Slides 2
- File Format PPTX
- Slide Ratio 16:9
- Color
Keywords
- #Content-Based Slides
- #Design-Based Slides
- #Business Management
- #Operational Plan
- #Diagram
- #Implementation Schedule
- #Project Implementation Schedule
- #Table
- #Standard Table
- #16:9
- #timeline table PowerPoint slide
- #business schedule management template
- #project timeline slide download
- #horizontal schedule template
- #operational planning presentation
About the Product
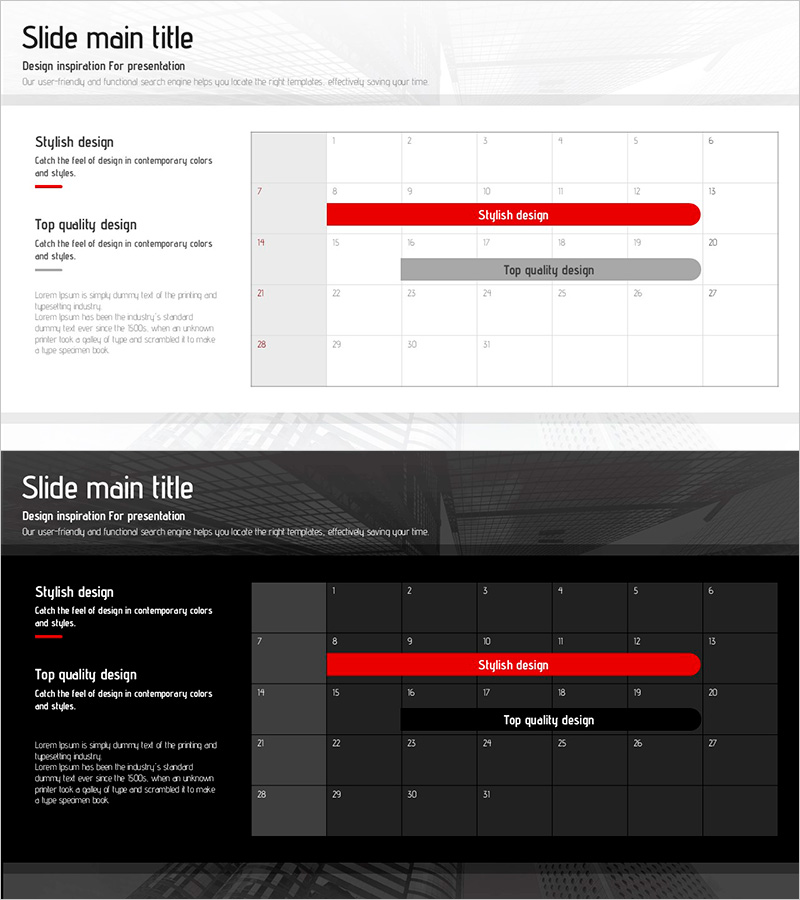
A horizontal timeline table PowerPoint slide designed for systematic project and business schedule management. This 2-slide presentation features a light background with red and gray accent bars that highlight key milestones and supporting tasks at a glance. The table format allows you to input monthly and weekly schedule items, making it ideal for project management, operational planning, and business progress reports. Compatible with all presentation environments in 16:9 widescreen PPTX format, ready for immediate use in your slides.
Usage Points
-
Main Usage
Visually organize and track project and business schedules by month and week. Red accent bars highlight key milestones while gray bars distinguish supporting tasks, making priorities clear and easy to communicate to stakeholders.
-
How to Use
Enter month, week, task name, owner, and progress percentage into the table cells. Adjust the length of red and gray bars to represent schedule duration, and change colors to differentiate by department or phase. Use in business plans, progress reports, and operational planning presentations.
-
Recommended For
Recommended for project managers, business coordinators, and operations managers presenting monthly and quarterly schedules. Suitable for all industries requiring schedule management—construction, manufacturing, IT, marketing—in business reports and operational planning presentations.
-
Slide Structure
2-slide layout with left text area (title and description) and right table area on each slide. Table features 6–7 columns (month, week, task, owner, progress, etc.) and approximately 15–20 rows, with red and gray horizontal bars visualizing schedule duration and task phases.
Related Products
-

Displays the Schedule Step by Step – Clear Communication of Project Timeline
#Business Management #Operational Plan #Diagram
-

Volume Calendar Template for Efficient Business Management
#Business Management #Operational Plan #Diagram
-

Schedule for Systematic Business Progress – Efficiency in Management
#Business Management #Operational Plan #Diagram
-

Summer Itinerary – Travel Planning and Style
#Business Management #Operational Plan #Diagram
