Structure PowerPoint Wide Template – Sleek Business Presentation Design
J0200018
- Last Update 01/05/2025
- File Size 13.5MB
- # of Slides 20
- File Format PPTX
- Slide Ratio 16:9
- Color
Slide Preview


Keywords
About the Product
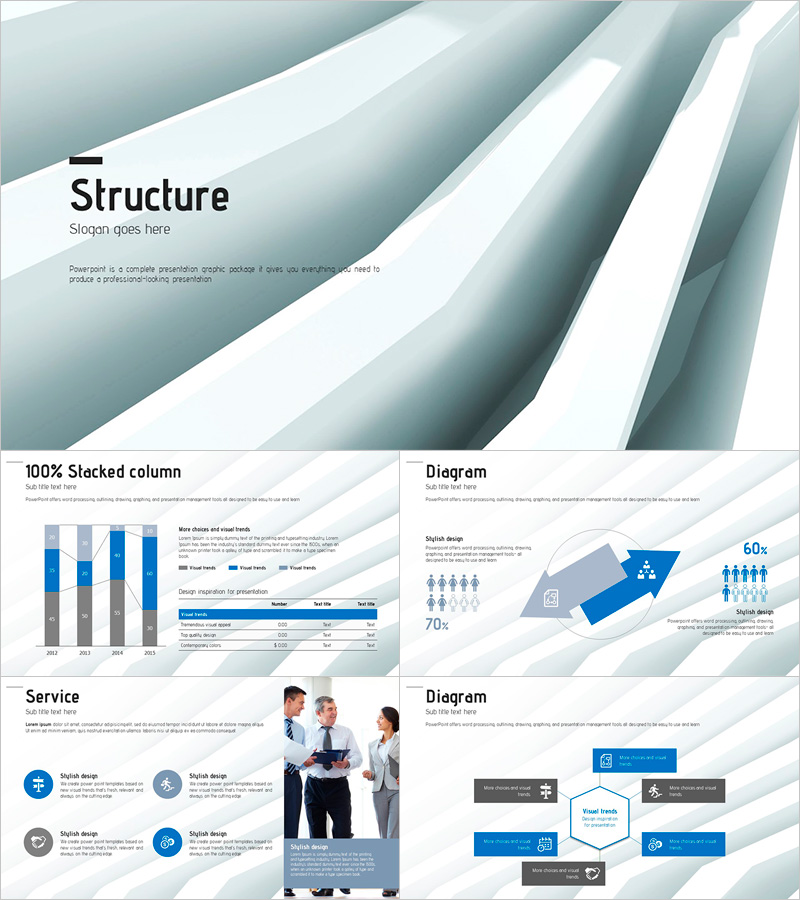
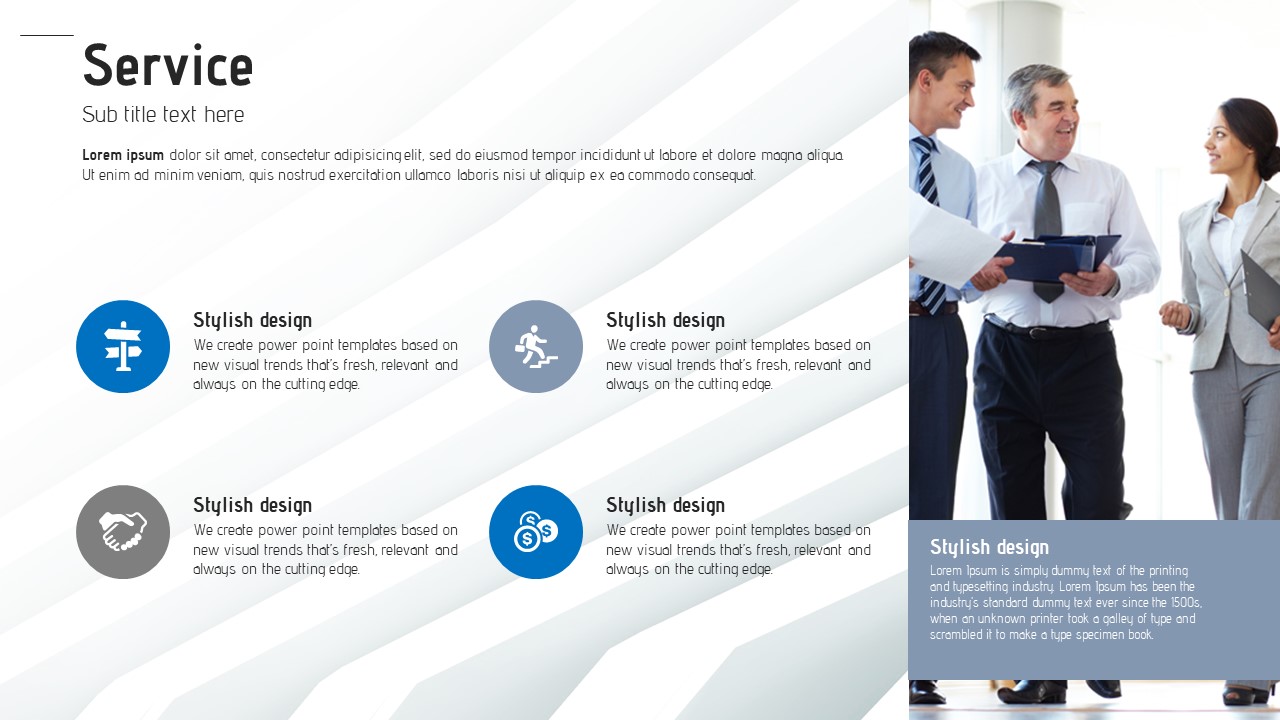
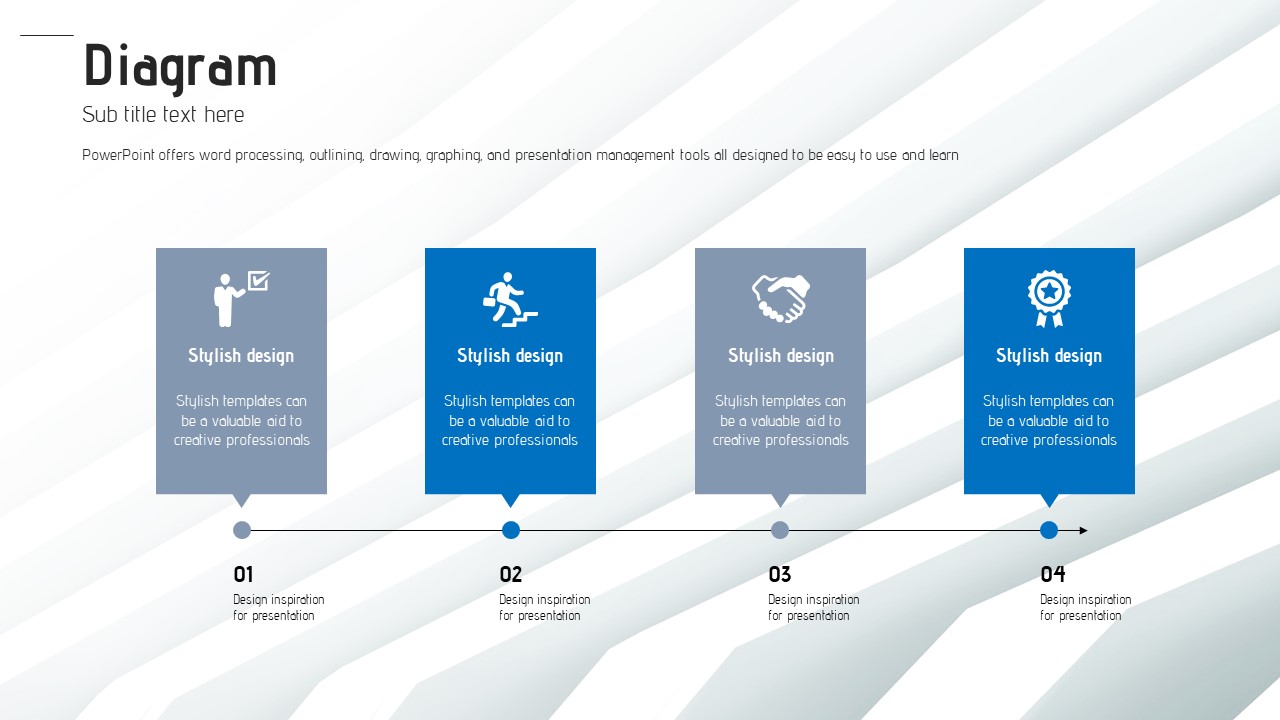
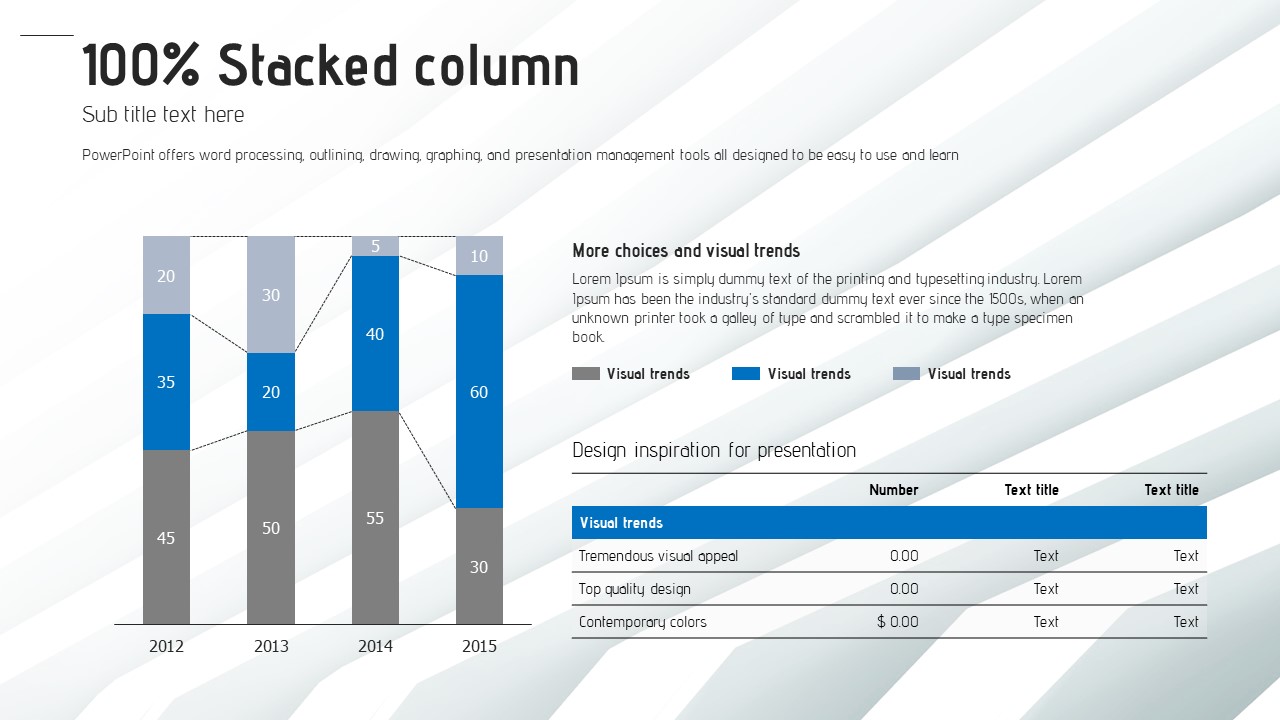
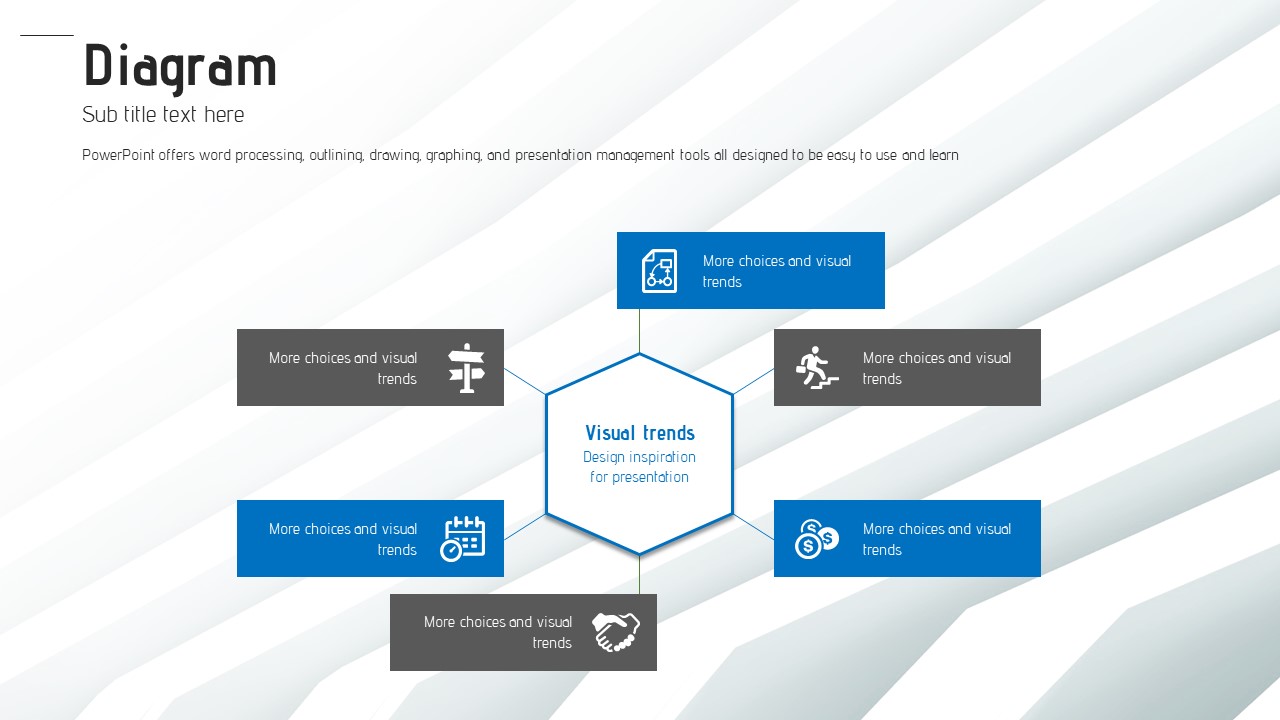
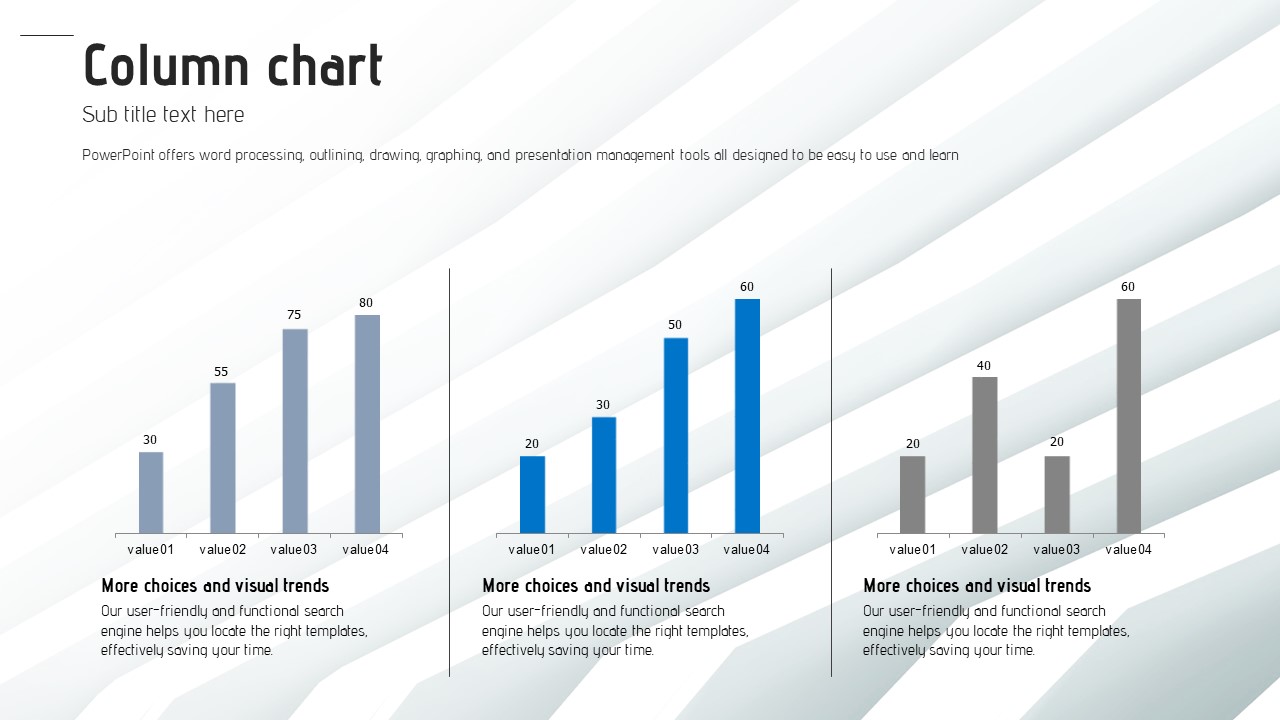
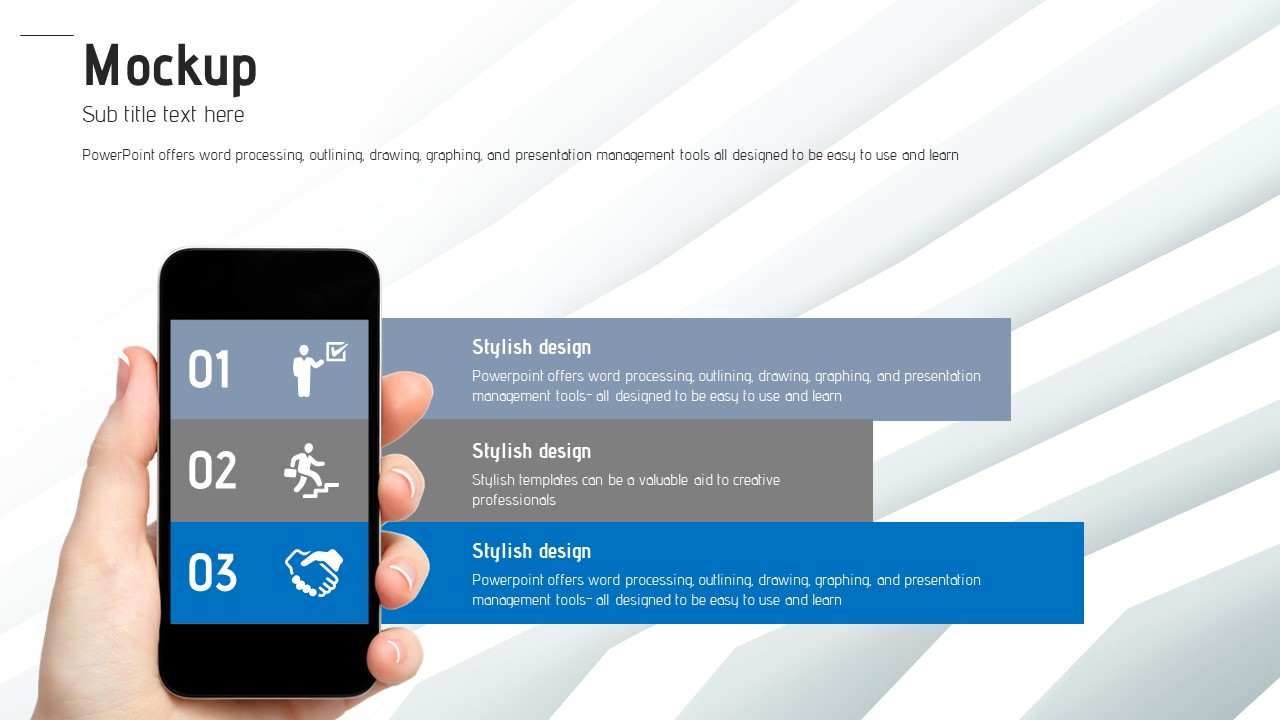
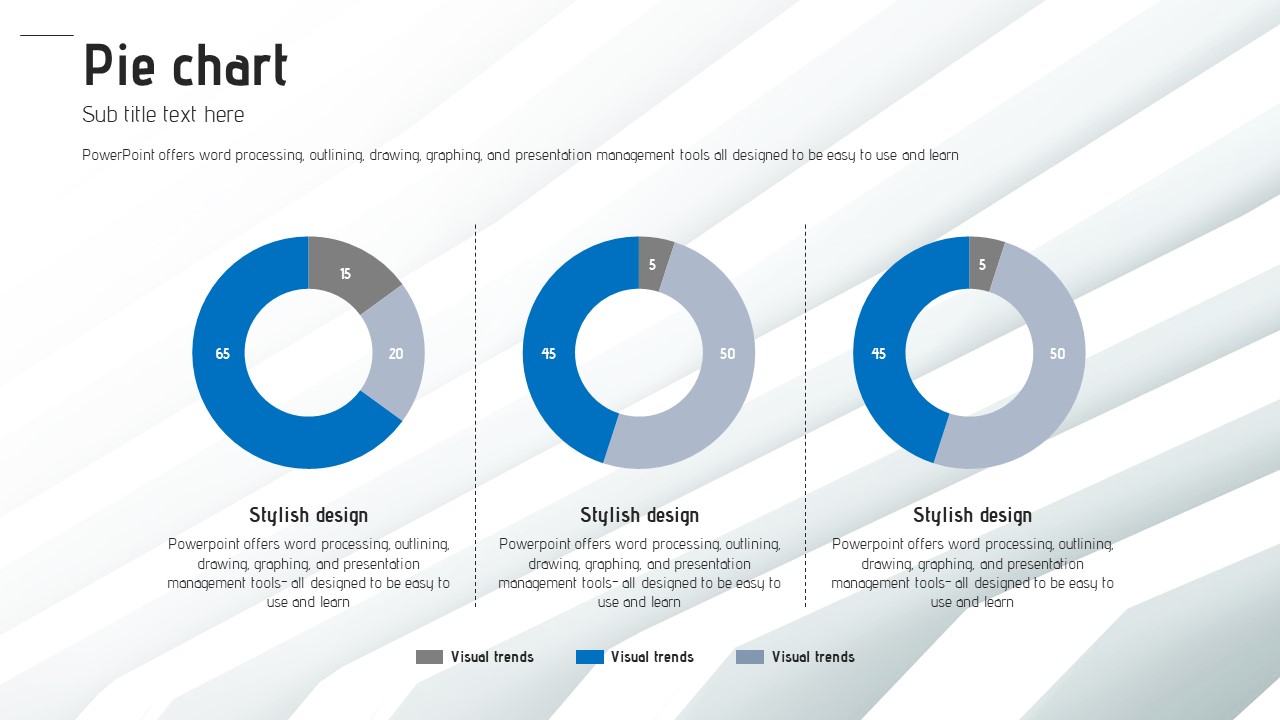
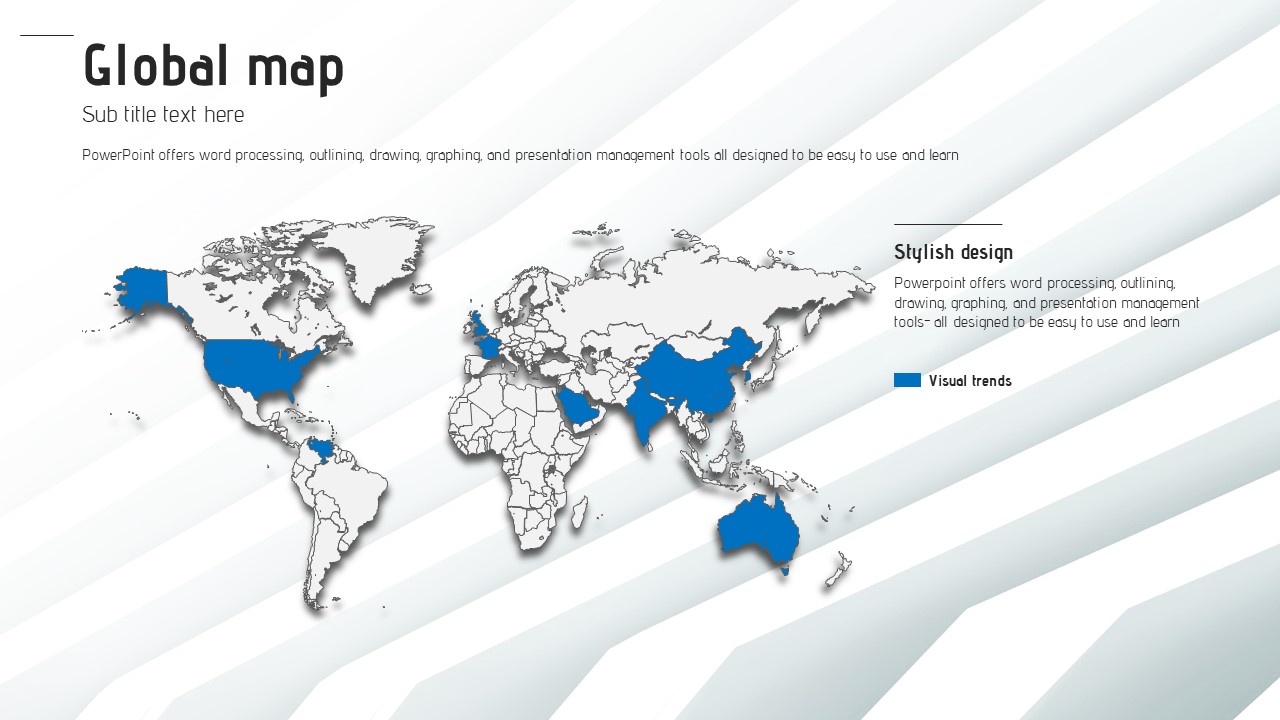
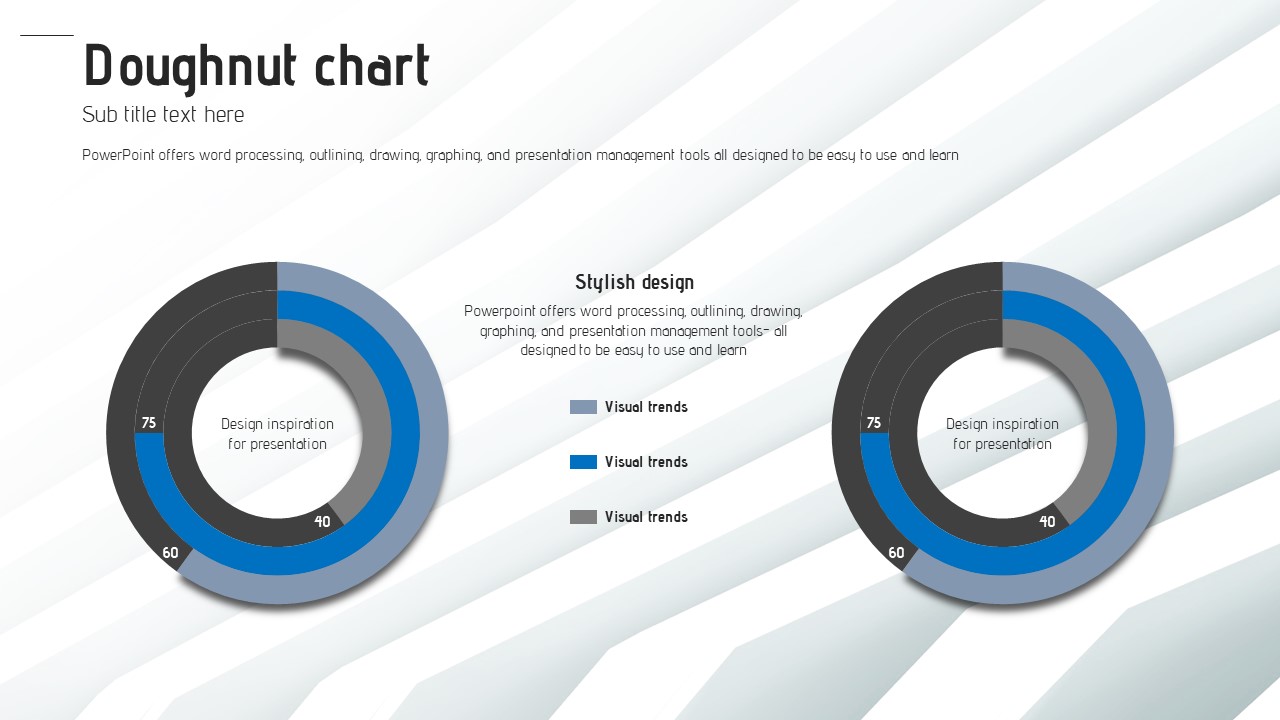
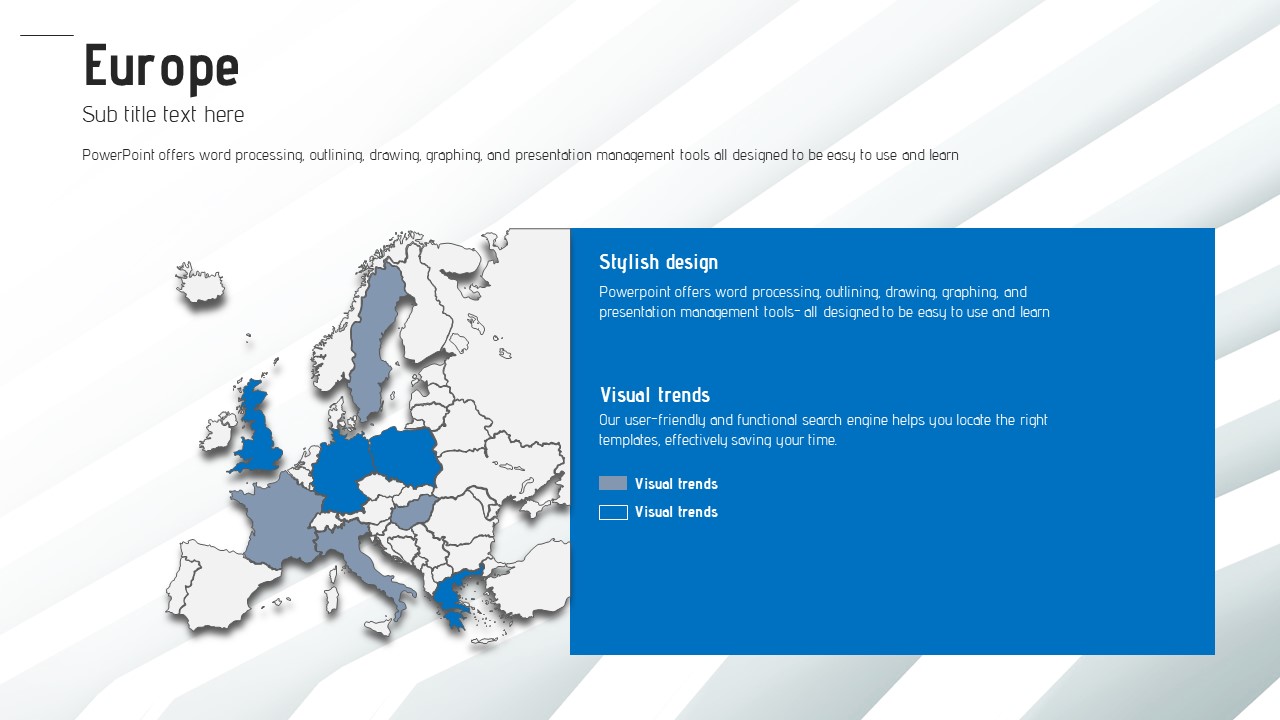
A professional business PowerPoint template featuring a bold diagonal structural graphic on a white and light gray background, accented with corporate blue. This 20-slide presentation deck covers all the slide types you need for real-world business use: a title slide with a three-dimensional structural backdrop, stacked bar charts for year-over-year comparisons, donut pie charts for three-way data breakdowns, arrow-and-icon diagrams with percentage callouts, service introduction slides combining photography and icon lists, a full-bleed blue break slide, and box-connector flowcharts. The two-column grid layout clearly separates text and data visualization areas, keeping your slides readable and well-organized. Delivered as an editable PPTX file, every element—text, colors, and chart data—can be updated instantly. Ideal for corporate reports, service pitches, investor presentations, and partner briefings across architecture, construction, IT, and consulting industries.
Usage Points
-
Main Usage
Designed for professional business presentations including corporate reports, service introductions, investor pitches, and partner briefings. The white-gray base with blue accents projects credibility and a structured, data-driven image.
-
How to Use
Open the PPTX file and replace placeholder text, chart data, and images with your own content. Bar and donut pie charts are Excel-linked for easy data updates. The two-column grid layout makes it simple to balance text and visuals on every slide.
-
Recommended For
Best suited for planners, marketers, and sales professionals in architecture, construction, IT, and consulting. Particularly recommended for investor meetings and partner presentations where a structured, authoritative visual style is essential.
-
Slide Structure
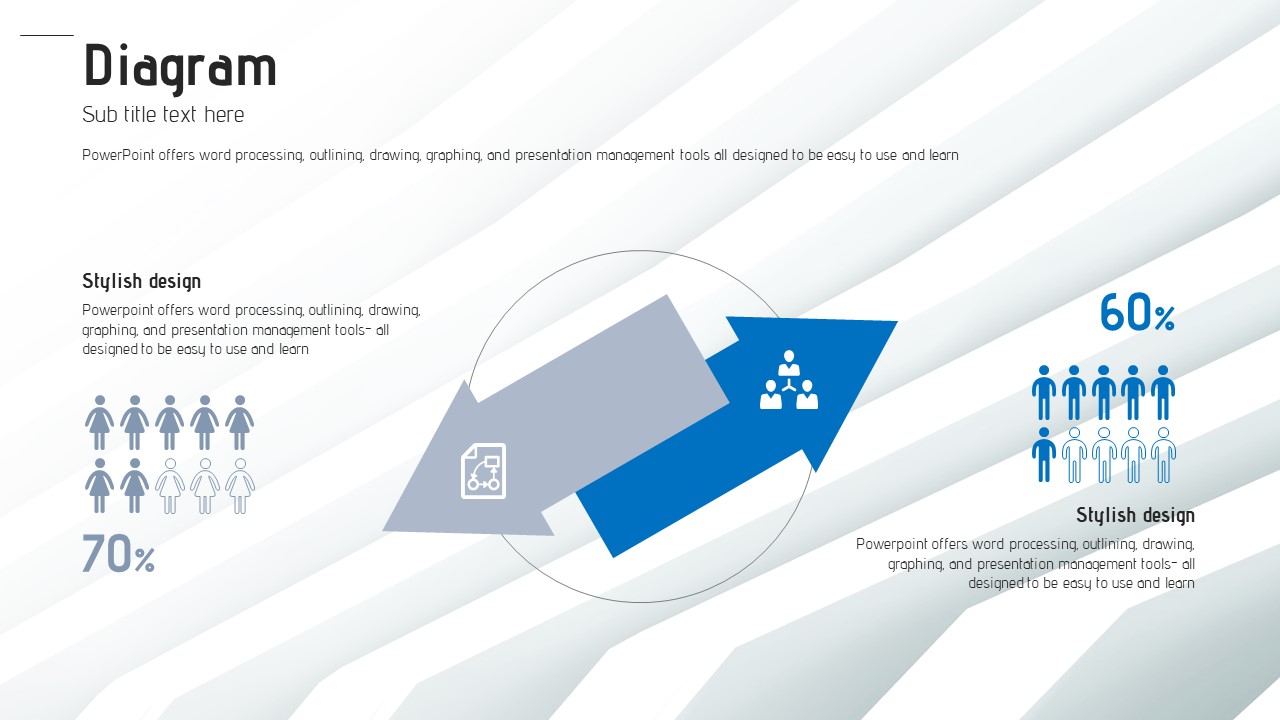
20 slides total: title slide with diagonal structural graphic, stacked bar chart (year-over-year), arrow-and-icon diagram with percentage callouts, service intro slide with photo and icon list, three donut pie charts for comparison, full-bleed blue break slide, and box-connector flowchart.


