Origami Vision Flow Diagram Template
RJ0200042_19
- Last Update 04/10/2025
- File Size 0.5MB
- # of Slides 2
- File Format PPTX
- Slide Ratio 16:9
- Color
Keywords
- #Content-Based Slides
- #Design-Based Slides
- #Business Strategy
- #Business Management
- #Diagram
- #Text Box
- #Roadmap
- #Execution Plan
- #Flow
- #Linear Flow
- #Rectangle Text Box
- #16:9
- #circular flow diagram PowerPoint
- #5-step process diagram
- #business roadmap slide template
- #vision flow chart PowerPoint
- #how to create process flow in PowerPoint
About the Product
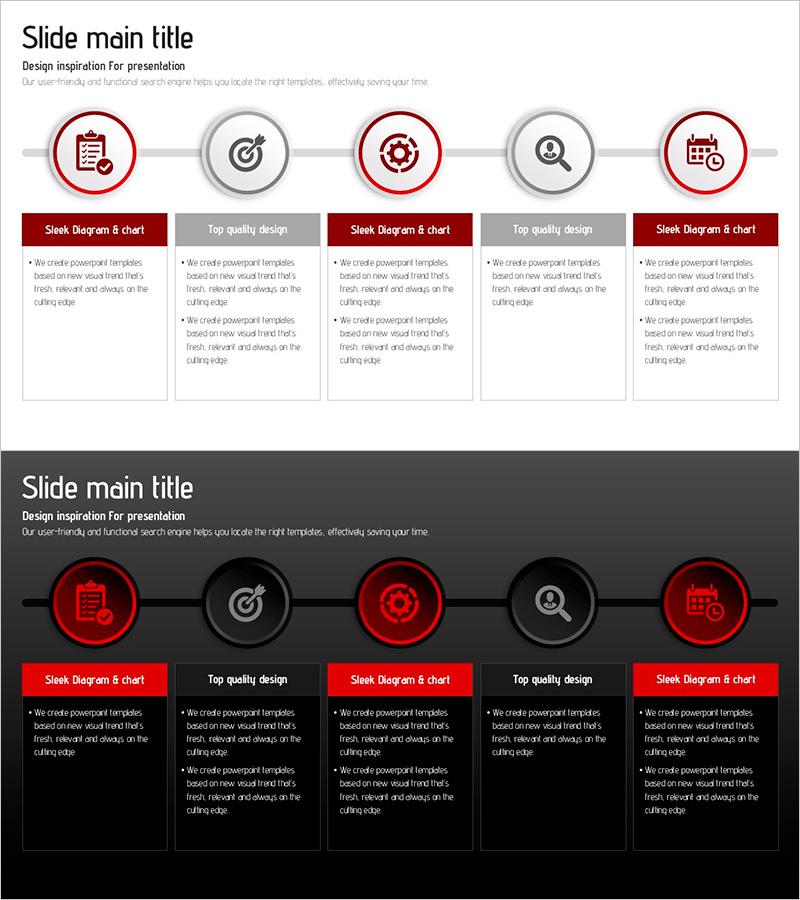
A circular flow diagram PowerPoint slide featuring five nodes connected in a horizontal sequence. Wine red and gray alternating icons clearly represent each stage, with connecting lines that guide the viewer through the process flow. This slide template is ready to use for business strategy presentations, roadmaps, vision statements, and any project requiring step-by-step progression visualization. Two layout options are included: a light background version for standard presentations and a dark background version for evening events or premium-style decks.
Usage Points
-
Main Usage
Ideal for visualizing sequential business processes, project timelines, strategic roadmaps, and cyclical improvement frameworks. The five-node circular structure effectively communicates repeating cycles or continuous improvement methodologies in executive presentations.
-
How to Use
Click on each node icon and text box to input your stage names and descriptions. Use the light background slide for standard business presentations and the dark background slide for evening events or sophisticated corporate decks. Both versions maintain consistent icon styling and layout proportions.
-
Recommended For
Executives, project managers, strategy planners, and marketing professionals presenting business direction, implementation plans, or improvement cycles. Recommended for investor presentations, company-wide strategy meetings, and team briefing materials.
-
Slide Structure
Two-slide set: light background (light gray and white) and dark background (charcoal and black). Each slide contains five circular nodes (alternating wine red and gray), horizontal connecting lines, and five text input boxes positioned below for stage descriptions.
Related Products
-

Detailed Schedule System – Presenting Efficient Project Plans
#Business Management #Diagram #Text Box
-

Green Isometric Execution Plan – Effective Business Management
#Business Management #Operational Plan #Diagram
-

Visualizing Business Strategy with Linear Flow Diagram in PowerPoint
#Business Strategy #Operational Plan #Diagram
-

Plogging Route Presentation Slide – 9-Point S-Curve Timeline
#Company Introduction #Business Strategy #Corporate Social Responsibility
