Origami Vision Donut Chart 2 – Market Analysis and Performance
RJ0200042_18
- Last Update 04/10/2025
- File Size 0.5MB
- # of Slides 2
- File Format PPTX
- Slide Ratio 16:9
- Color
Keywords
- #Content-Based Slides
- #Design-Based Slides
- #Market and Competitor Analysis
- #Financial Plans and Performance
- #Graph
- #Competitor Analysis
- #Sales and Revenue
- #Circles
- #Doughnut Chart
- #16:9
- #donut chart PowerPoint
- #pie chart slide template
- #4-segment donut diagram
- #market analysis chart
- #performance comparison graph
- #business data visualization PowerPoint
About the Product
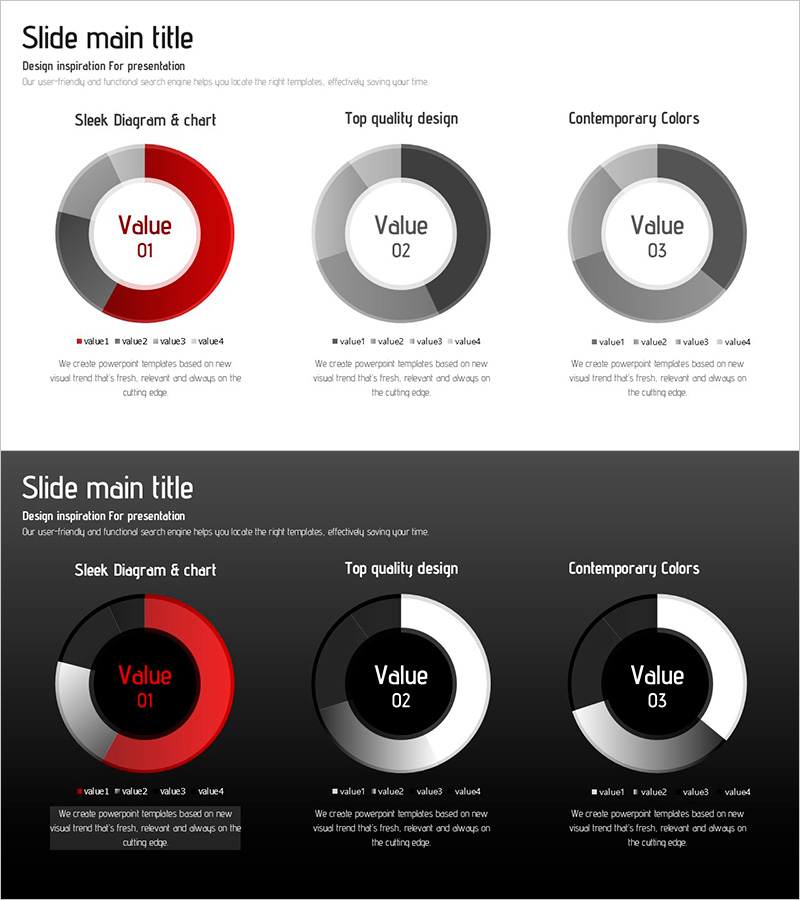
A professional donut chart PowerPoint slide designed for market analysis and performance comparison with 4-segment data visualization. This presentation template includes two layout variations: light background and dark background versions, each featuring different color combinations in red, gray, and black tones. The center circular area accommodates key metrics or titles, while the 4-segment donut structure intuitively represents data proportions. Instantly applicable to business reports, marketing plans, sales presentations, and investor pitch decks.
Usage Points
-
Main Usage
The donut chart format is optimized for displaying proportional data divided into 4 segments, making it ideal for visualizing market share, revenue composition, customer distribution, and performance metrics. The center circular area emphasizes key figures or titles, enhancing visual impact and data comprehension.
-
How to Use
Use this slide in the opening section of presentations to introduce market conditions or business performance. Customize the segment colors and legend to match your data, then input key indicators or time periods in the center text area. The light background suits daytime presentations, while the dark background works better for evening events or projector environments.
-
Recommended For
Marketing managers, sales directors, financial analysts, and business planners benefit from this template when preparing quarterly performance reports, market analysis documents, and investor presentations. It effectively enhances data credibility in executive briefings and client proposals requiring multi-item ratio comparisons.
-
Slide Structure
2-slide set featuring light background version (white/light gray) with red, gray, black, and light gray 4-segment donut chart, and dark background version (black/dark gray) with red, white, and light gray 4-segment donut chart. Each donut is evenly divided into 4 sections with center text input areas labeled 'Value 01~03'.
Related Products
-

Market Analysis Visualization with Bar Chart – Your Competitive Advantage Slide
#Market and Competitor Analysis #Financial Plans and Performance #Graph
-

Donut Chart Slide for Interior Demand Survey
#Market and Competitor Analysis #Financial Plans and Performance #Graph
-

Competitor Progress Comparison Analysis Graph – Essential Tool for Market Analysis
#Market and Competitor Analysis #Graph #Competitor Analysis
-

Market Trend Analysis Charts & Diagrams – Essential Tool for Competitor Analysis
#Market and Competitor Analysis #Graph #Competitor Analysis
