Vertical Bar Graph for Vision Growth – Business Development Strategy
RJ0200042_9
- Last Update 04/10/2025
- File Size 1MB
- # of Slides 2
- File Format PPTX
- Slide Ratio 16:9
- Color
Keywords
- #Content-Based Slides
- #Design-Based Slides
- #Company Introduction
- #Business Strategy
- #Graph
- #Key Achievements
- #Financial Outlook & Expected Impact
- #Column
- #Column Chart
- #Project Progress
- #16:9
- #vertical bar chart PowerPoint
- #bar graph slide template
- #business development strategy chart
- #vision growth visualization
- #data comparison presentation
About the Product
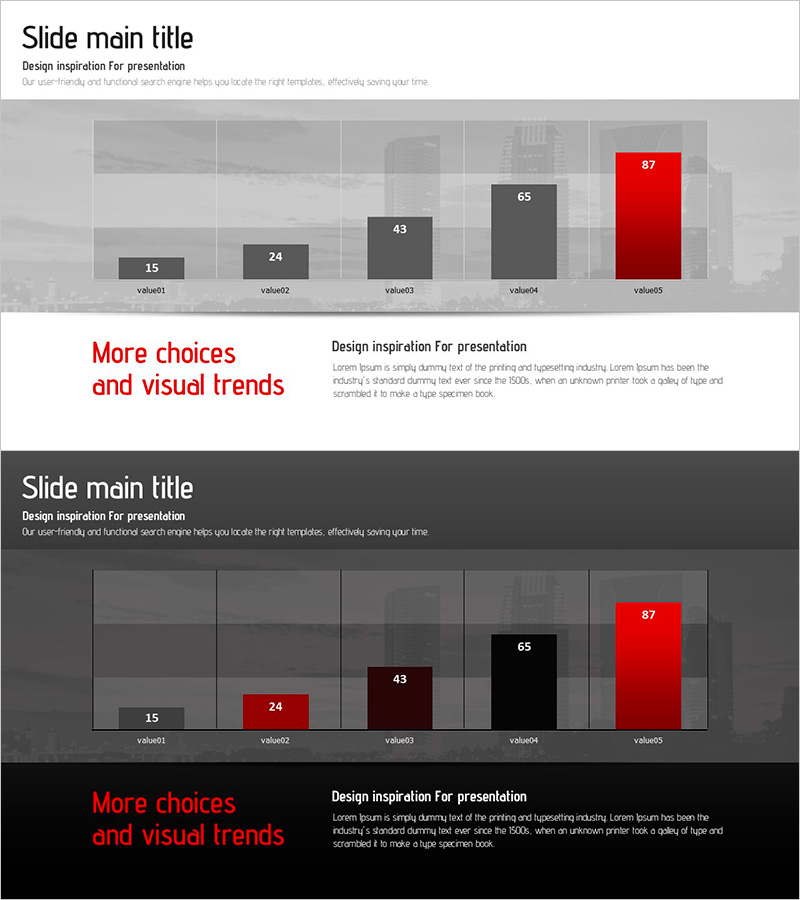
A vertical bar chart PowerPoint slide designed to clearly present business development strategy and vision growth metrics through numerical comparison. This slide features five data items displayed as ascending bars, with the final bar highlighted in red to emphasize key performance or target achievement. Two background versions—light and dark—are provided to suit different presentation environments. With 2 slides total, you can easily edit data values to reflect actual business figures and customize item labels for your specific metrics.
Usage Points
-
Main Usage
Clearly communicate step-by-step performance indicators or vision achievement metrics during business development presentations. The ascending bar heights intuitively show growth trends across five categories, while the red highlight draws attention to the final target or key achievement.
-
How to Use
Use in executive reports, business plan presentations, and quarterly performance review meetings. Replace data values (15, 24, 43, 65, 87) with your actual metrics and update item labels (value01–value05) to match your business indicators.
-
Recommended For
Business managers, project leads, and executives presenting performance metrics benefit from this template. Ideal for visualizing quarterly or annual growth rates, sales performance, customer satisfaction scores, and other numerical comparisons.
-
Slide Structure
Five vertical bars representing data items with values ranging from 15 to 87. The final bar is highlighted in red while others use gray tones. Two layout versions are included: one with a light cityscape background and one with a dark background, both featuring the same chart structure.
Related Products
-

Infographic Presentation Visualizing Market Share and Growth Prospects
#Business Strategy #Technical Approach #Graph
-

Highlighting Line Graphs in Volume Presentation Template
#Business Strategy #Graph #Financial Outlook & Expected Impact
-

Bar and Column Charts Investigating Important Factors in Marriage
#Business Vision and Strategy #Business Strategy #Graph
-

Business Forest Wide Template Column Chart
#Company Introduction #Graph #Company Overview
