Origami Presentation Template – Market Insights and Vision Map Analysis
RJ0200042_25
- Last Update 04/10/2025
- File Size 1MB
- # of Slides 2
- File Format PPTX
- Slide Ratio 16:9
- Color
Keywords
About the Product
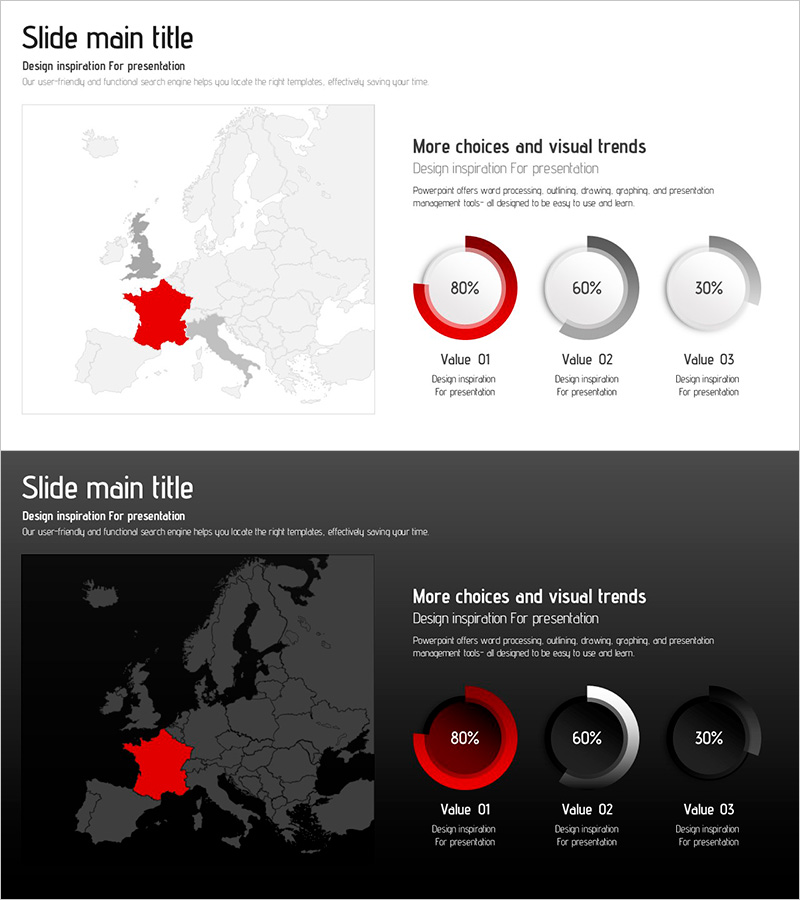
A 2-slide PowerPoint presentation featuring a detailed Europe map with France highlighted in red, paired with three donut charts displaying regional data (80%, 60%, 30%). Available in both light and dark background versions to match your presentation theme. The layout combines geographic visualization on the left with comparative data metrics on the right, enabling simultaneous analysis of regional market performance, sales distribution, or customer demographics. All elements including map colors, chart values, and text are fully editable for customization.
Usage Points
-
Main Usage
Visualize regional market performance, sales figures, or customer distribution across European territories using an integrated map and data chart approach. Ideal for global business strategy presentations, market expansion reports, and international performance reviews where geographic context and quantitative metrics must be presented together.
-
How to Use
Place the Europe map on the left side with your target country (France) highlighted in red. Input regional data into the three donut charts on the right, representing key metrics such as revenue, market share, or growth rate. Choose the light background slide for bright presentation themes or the dark background slide for dark-themed presentations to maintain visual consistency throughout your deck.
-
Recommended For
Global marketing managers, international sales teams, business development executives, and strategy consultants. Particularly suited for European market entry presentations, regional performance analysis, cross-country comparisons, and executive briefings in multinational corporations, consulting firms, and financial institutions.
-
Slide Structure
Slide 1: Light gray background with Europe map (France in red) on left side and three donut charts (80%, 60%, 30%) on right. Slide 2: Identical layout with dark gray background. Each chart is independently editable with customizable labels, values, and legend positioning.
Related Products
-

Target Area Status Analysis Graph – Data and Insights
#Company Introduction #Market and Competitor Analysis #Graph
-

Target Country Market Share Analysis Graph
#Market and Competitor Analysis #Graph #Other
-

Analysis of Key Target Countries Slide - Market and Competitor Analysis
#Company Introduction #Market and Competitor Analysis #Graph
-

Infographic Slide for Regional Data Visualization
#Market and Competitor Analysis #Marketing Plan and Strategy #Graph
