Diagonal Line IR PowerPoint Template – Sleek Design for Effective Fundraising
M0600005
- Last Update 03/31/2025
- File Size 37.8MB
- # of Slides 33
- File Format PPTX
- Slide Ratio 16:9
- Color
Slide Preview


Keywords
About the Product
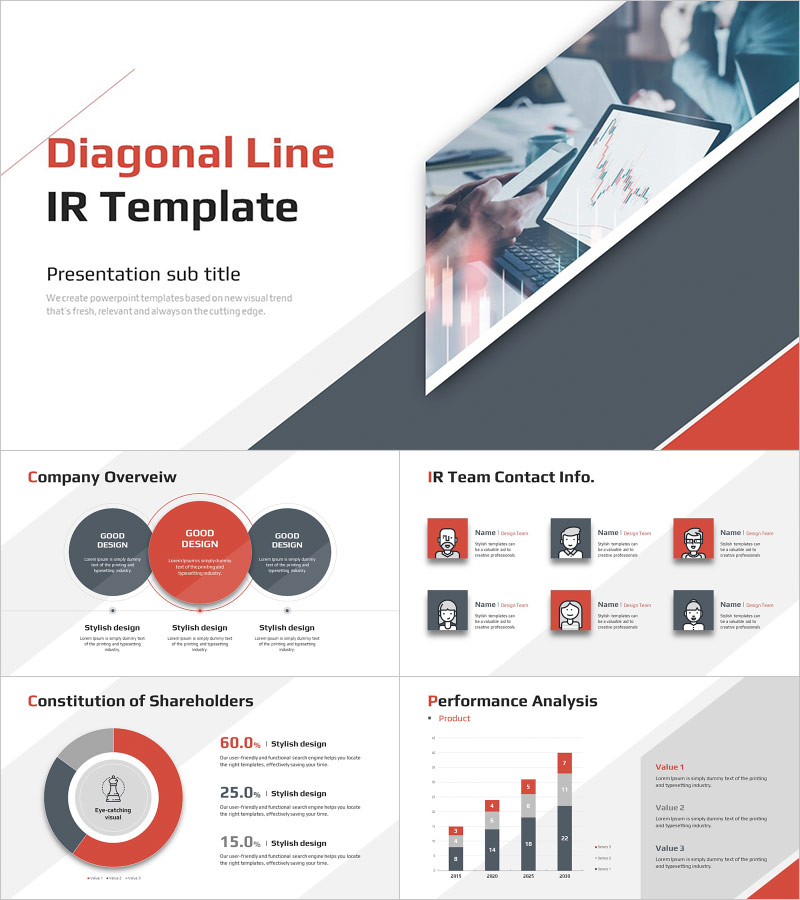
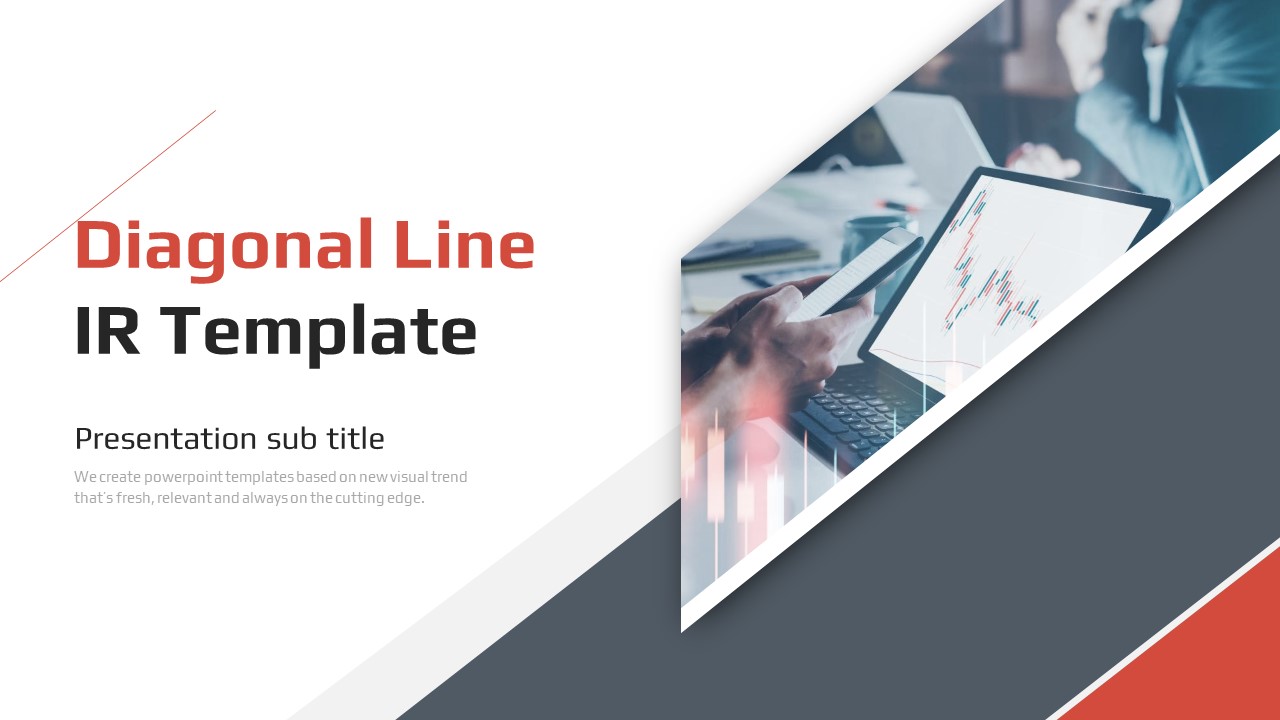
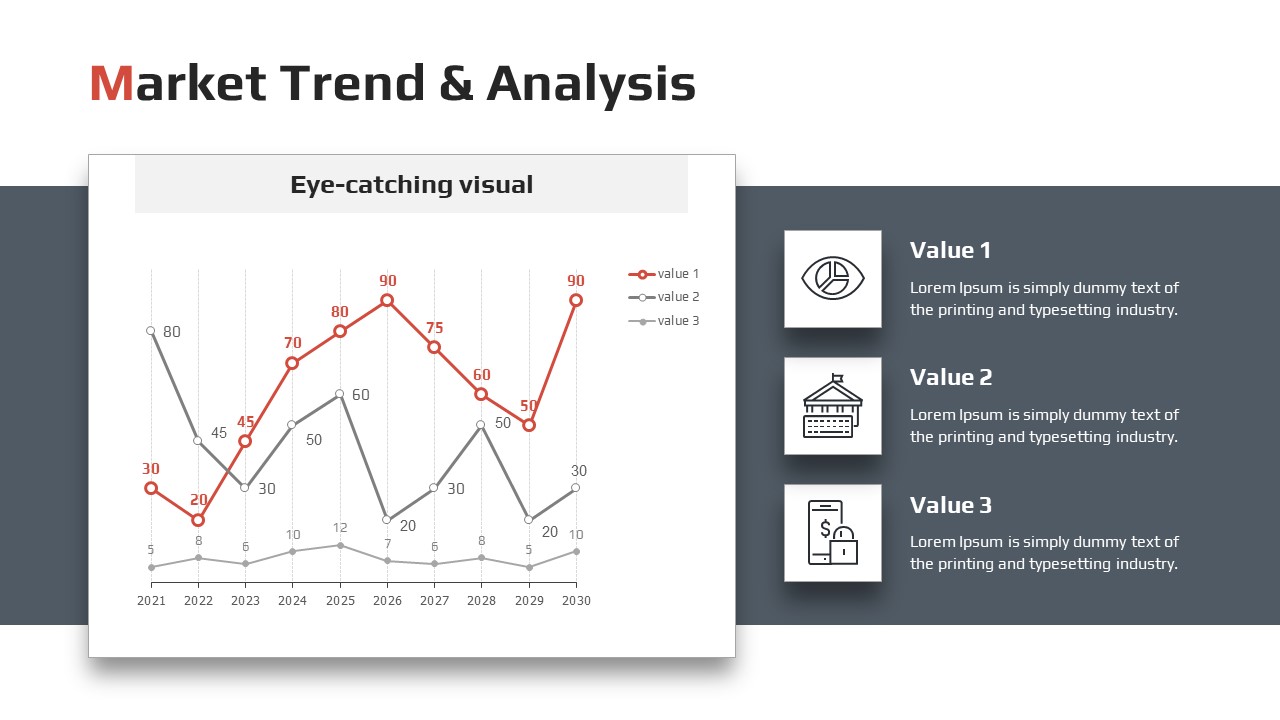
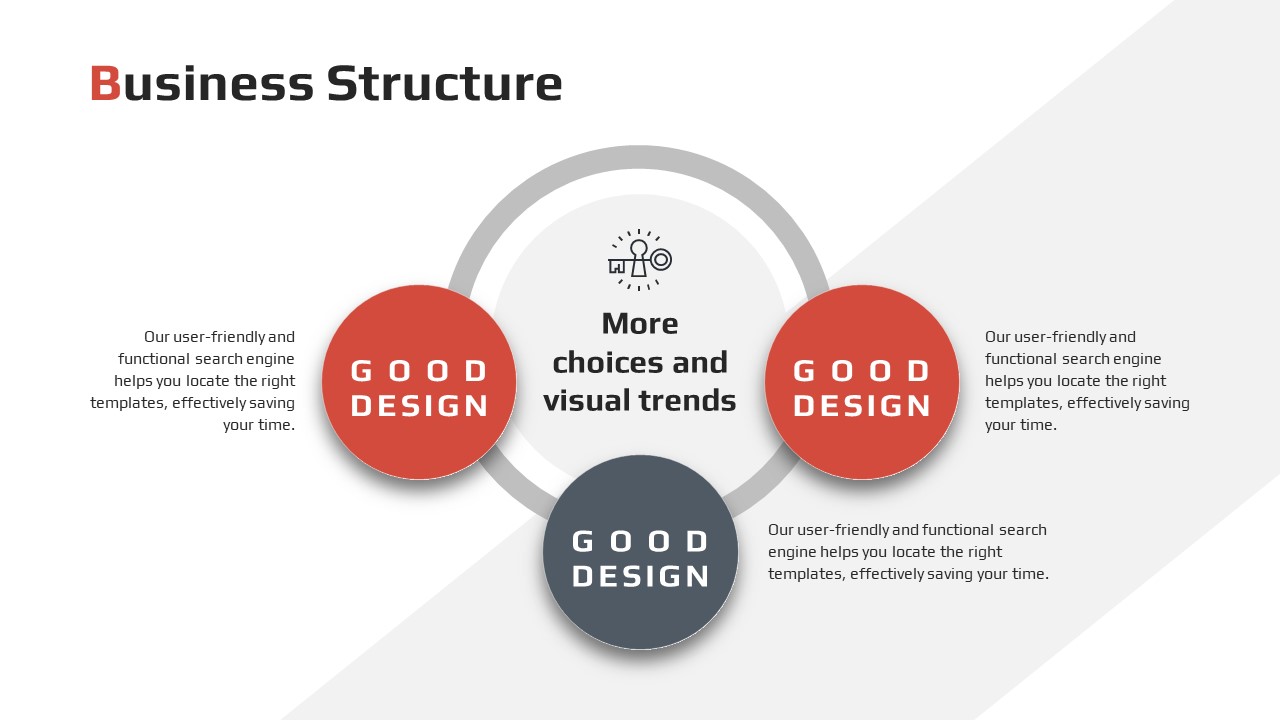
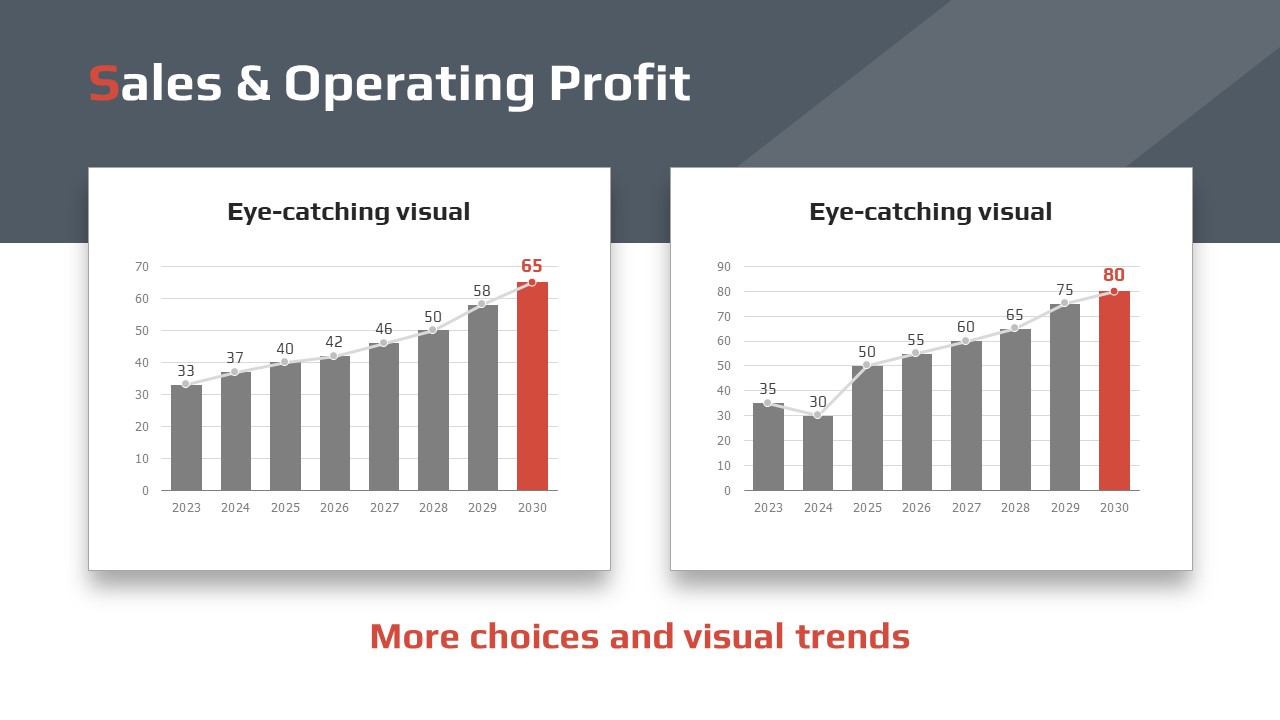
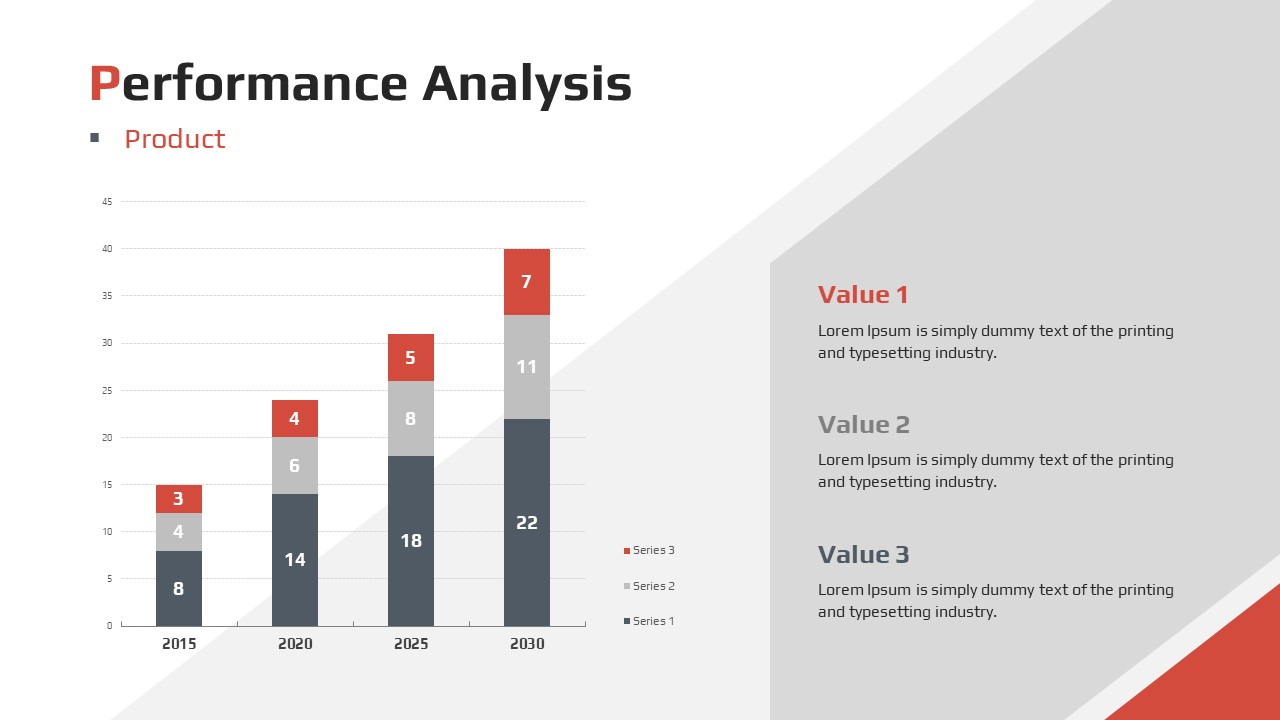
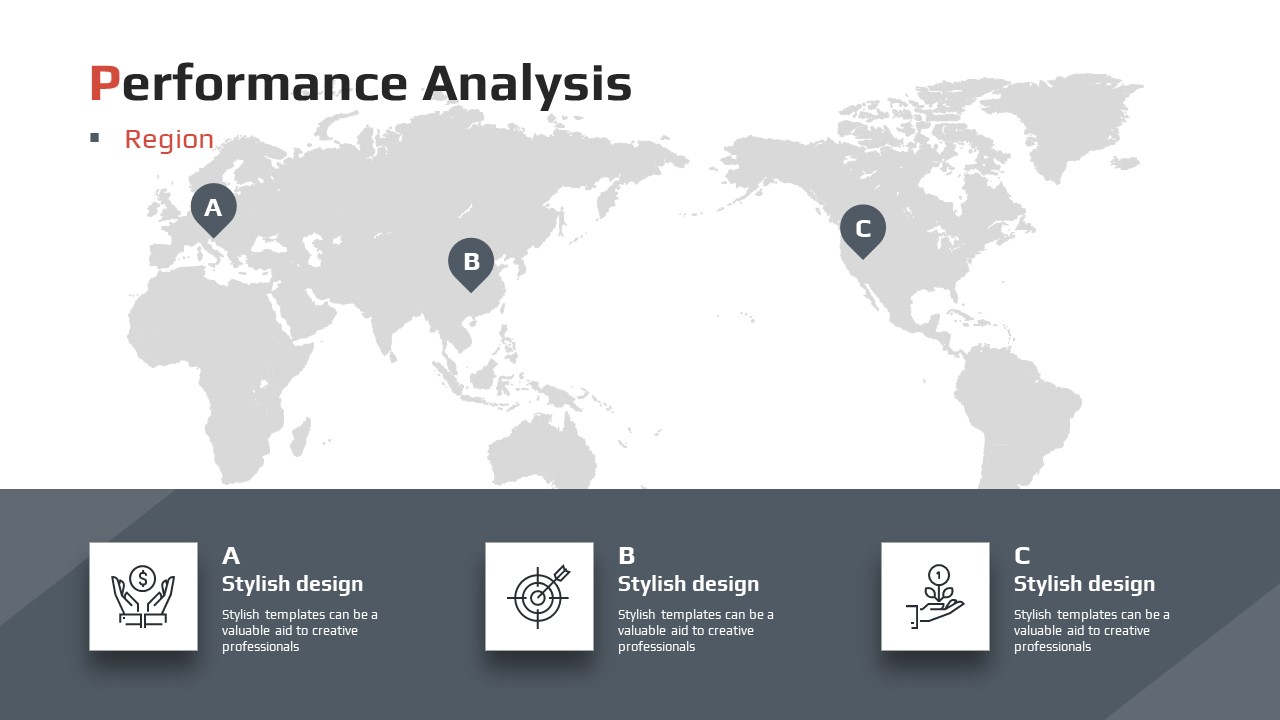
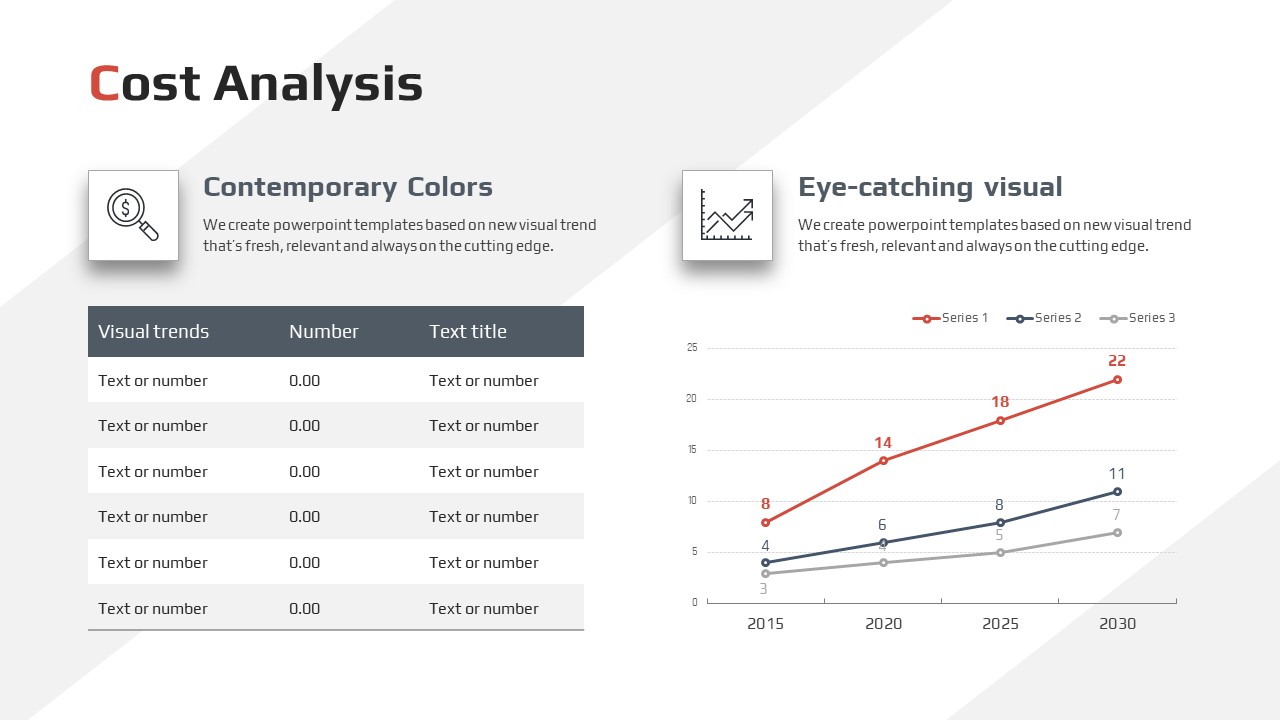
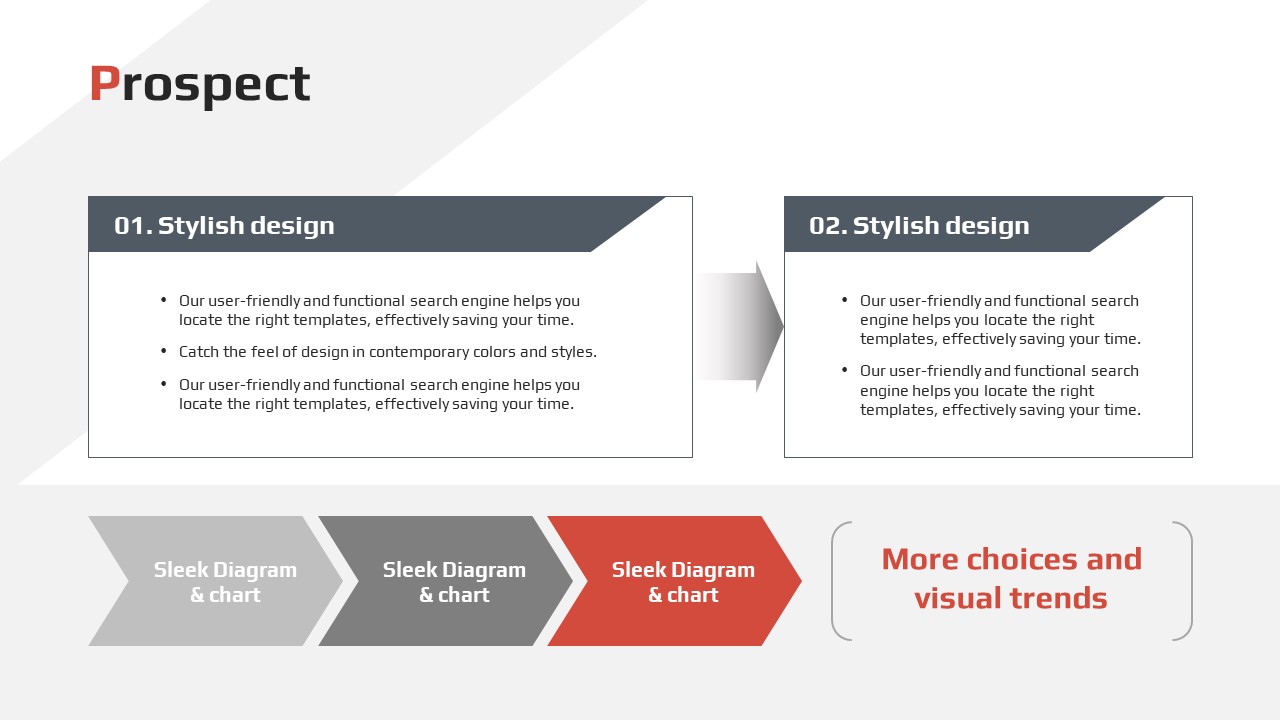
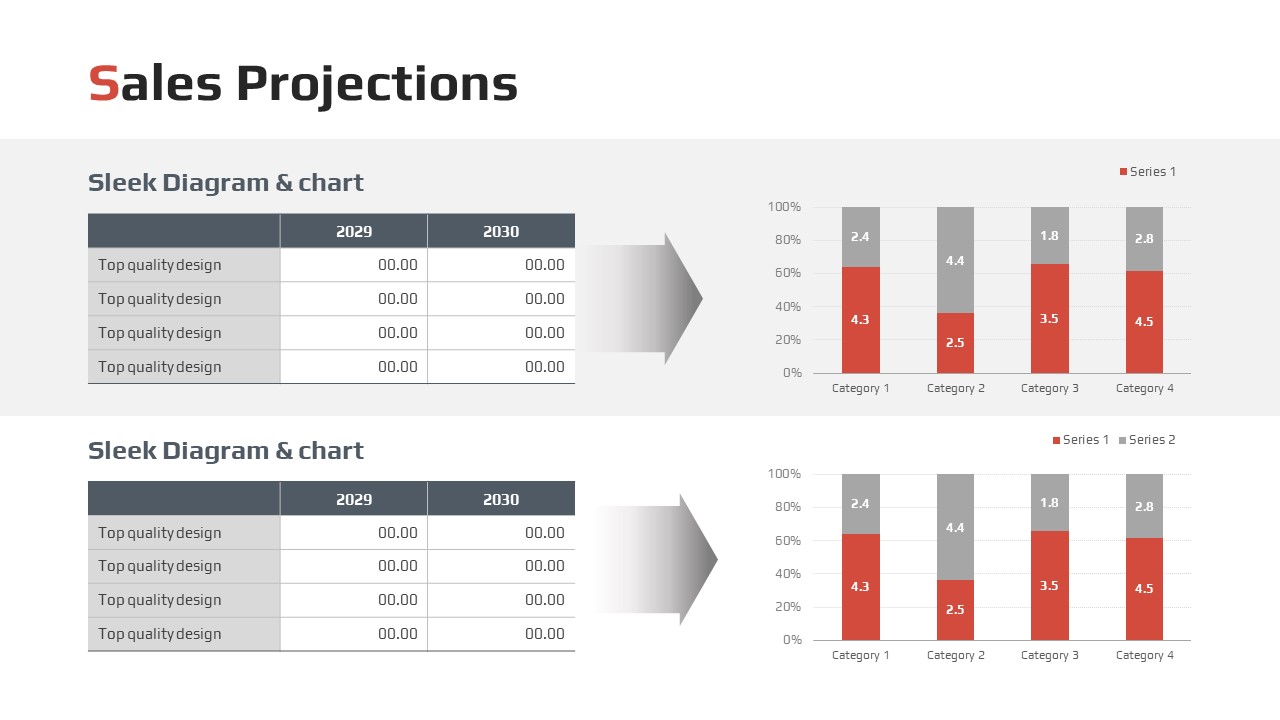
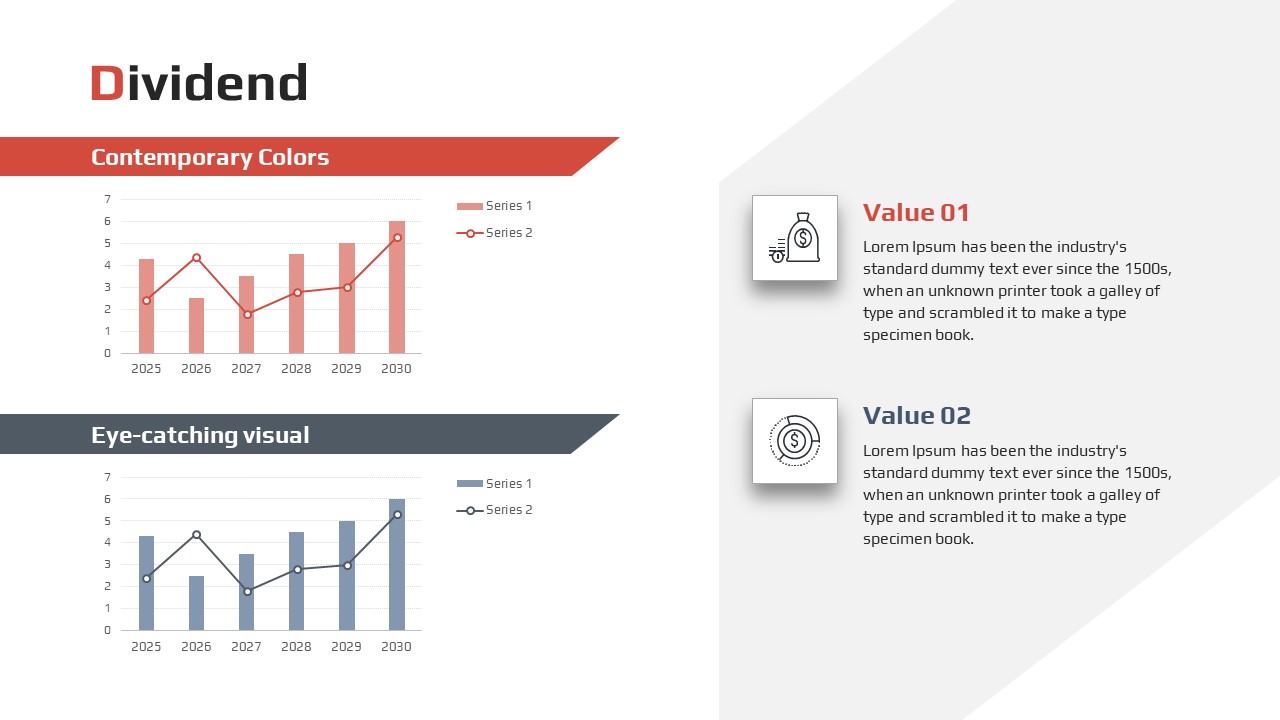
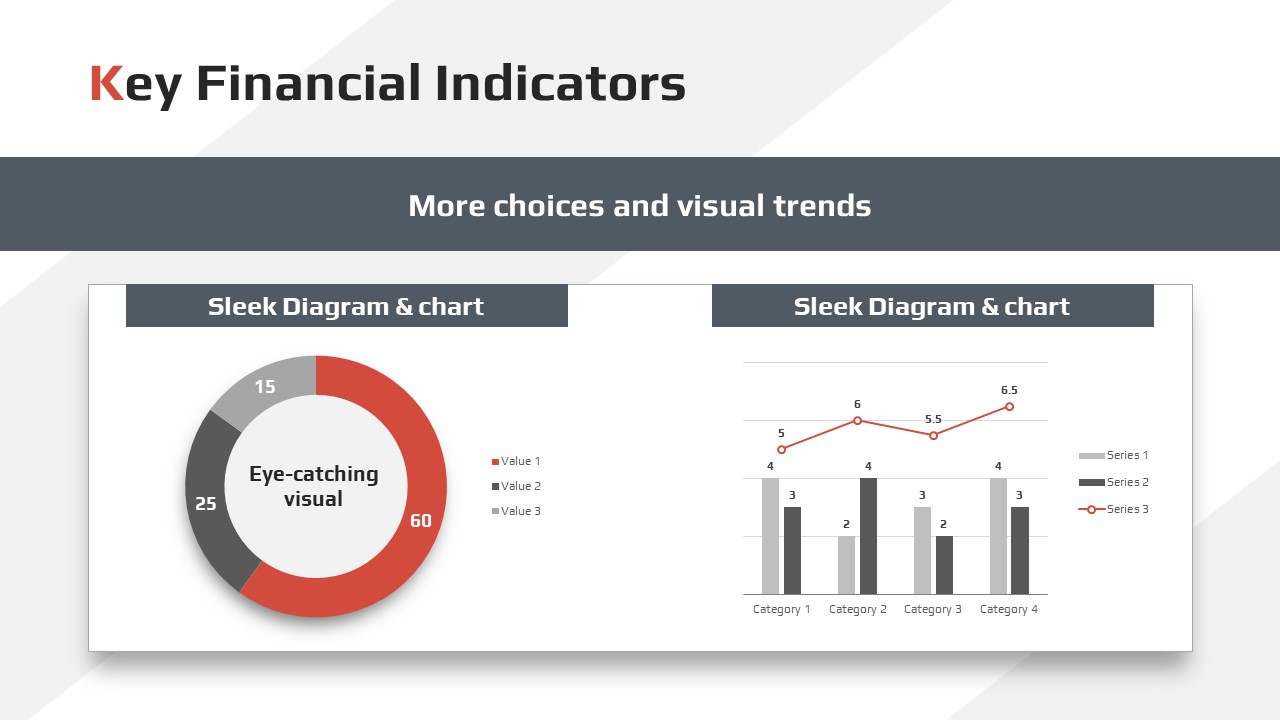
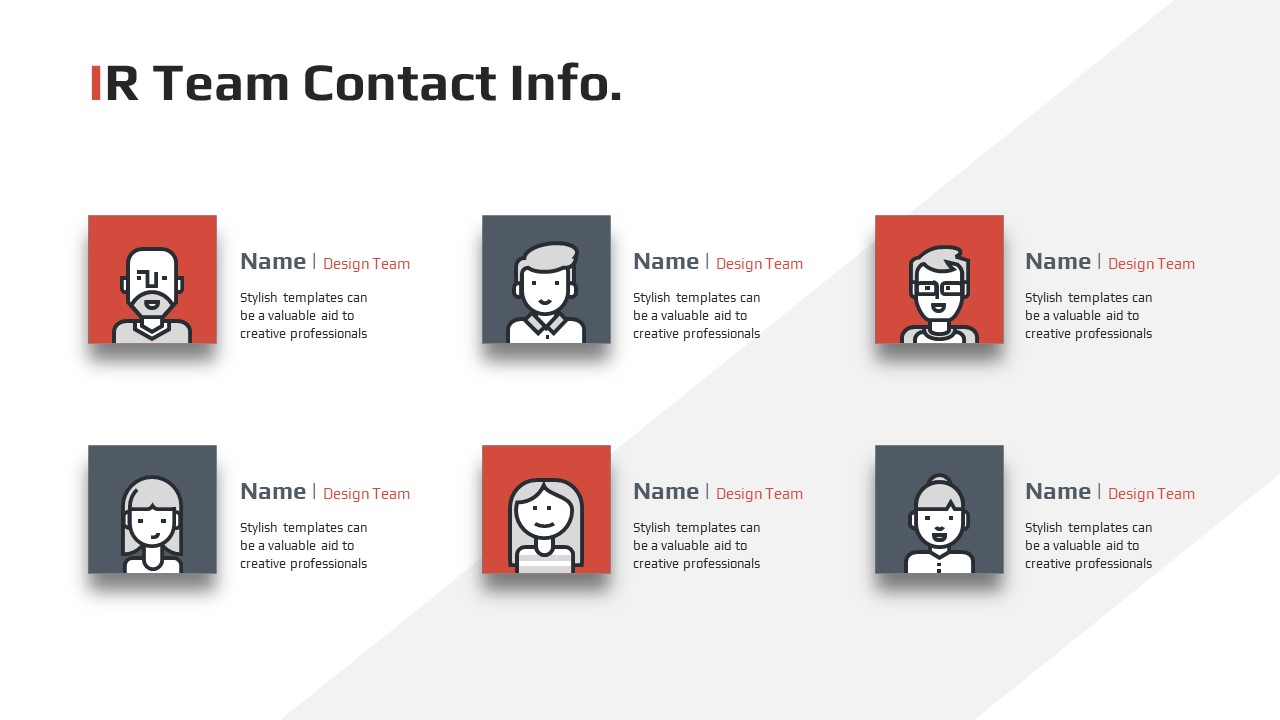
A professional investor relations PowerPoint template optimized for fundraising presentations. Built on a white base with bold red accents and dark charcoal gray, the diagonal layout delivers a dynamic yet authoritative impression that captures investor attention from the first slide. The 33-slide deck covers all essential IR sections in standard sequence: company overview, business structure, shareholder composition, performance analysis, IR team contacts, and business performance breakdown. Data visualization slides include a donut chart for shareholder ratios, a vertical bar graph tracking year-over-year performance from 2015 to 2030, and six-person team profile cards. Section numbers and red-highlighted subheadings create a clear three-tier information hierarchy, making it easy for investors to follow the narrative. Delivered as an editable PPTX file, every text block, chart value, and color element can be customized to match your company's data and branding. Ideal for demo days, VC meetings, and Series A through C fundraising rounds.
Usage Points
-
Main Usage
Designed for investor relations presentations including demo days, VC pitch meetings, and Series funding rounds. The 33-slide structure follows the standard IR narrative from company overview through financial performance, giving investors a complete picture in a single cohesive deck.
-
How to Use
Open the PPTX file and replace placeholder text, chart values, and team photos with your company's actual data. Update the donut chart shareholder ratios, the bar graph performance figures for each year, and the six team profile cards in sequence. The diagonal layout and color scheme remain intact, so your presentation looks polished with minimal effort.
-
Recommended For
Best suited for startup founders, CFOs, and IR managers who need to present to investors. Works equally well for early-stage companies preparing their first pitch and growth-stage companies conducting Series A, B, or C fundraising rounds. Also useful for corporate IR departments preparing annual investor briefings.
-
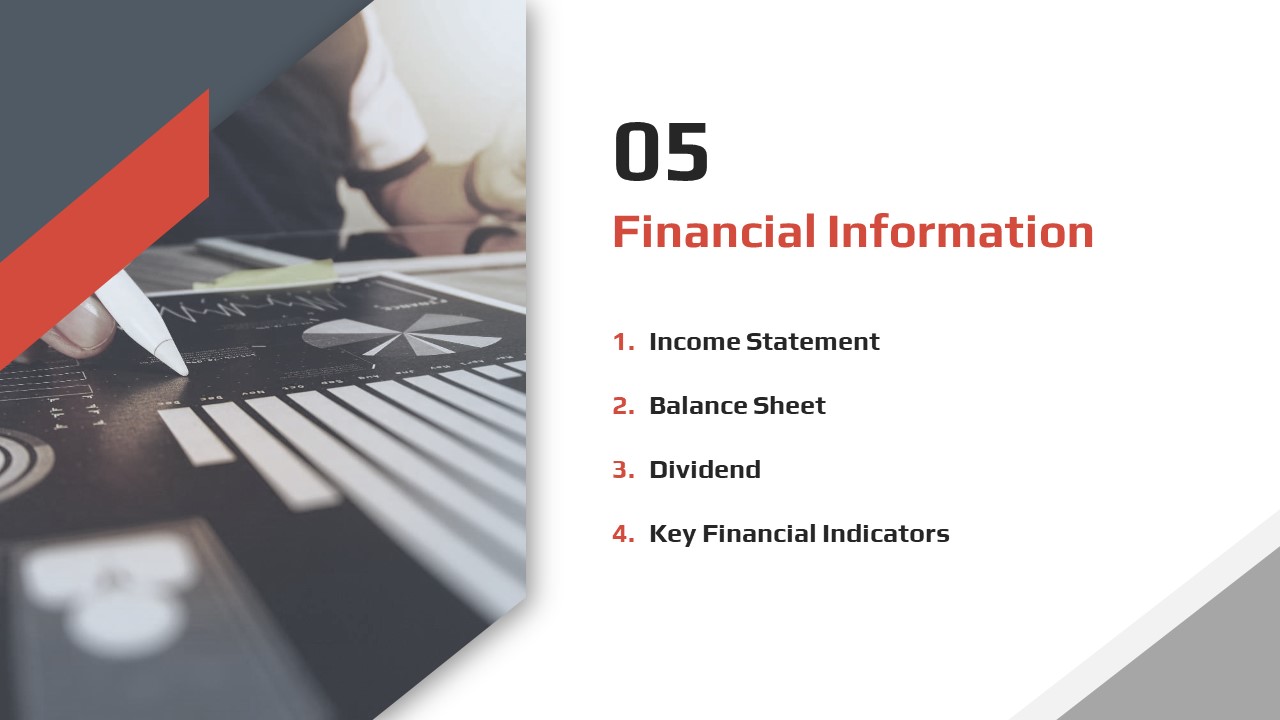
Slide Structure
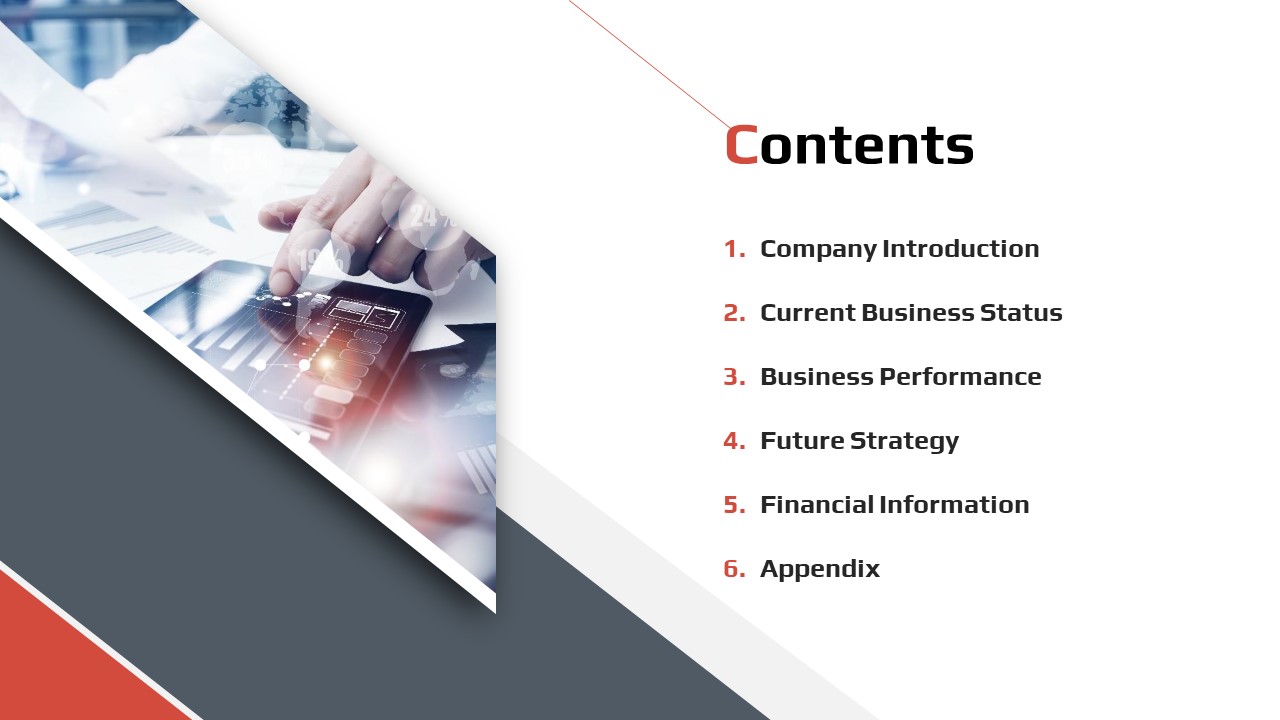
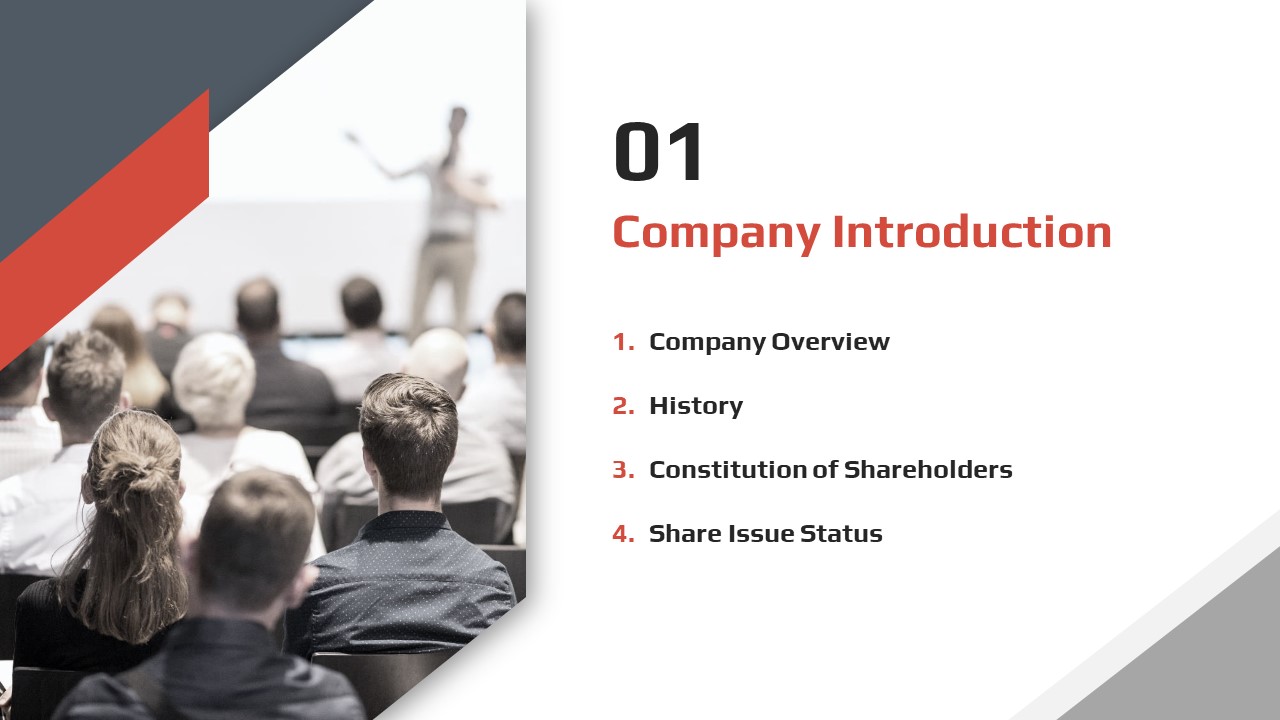
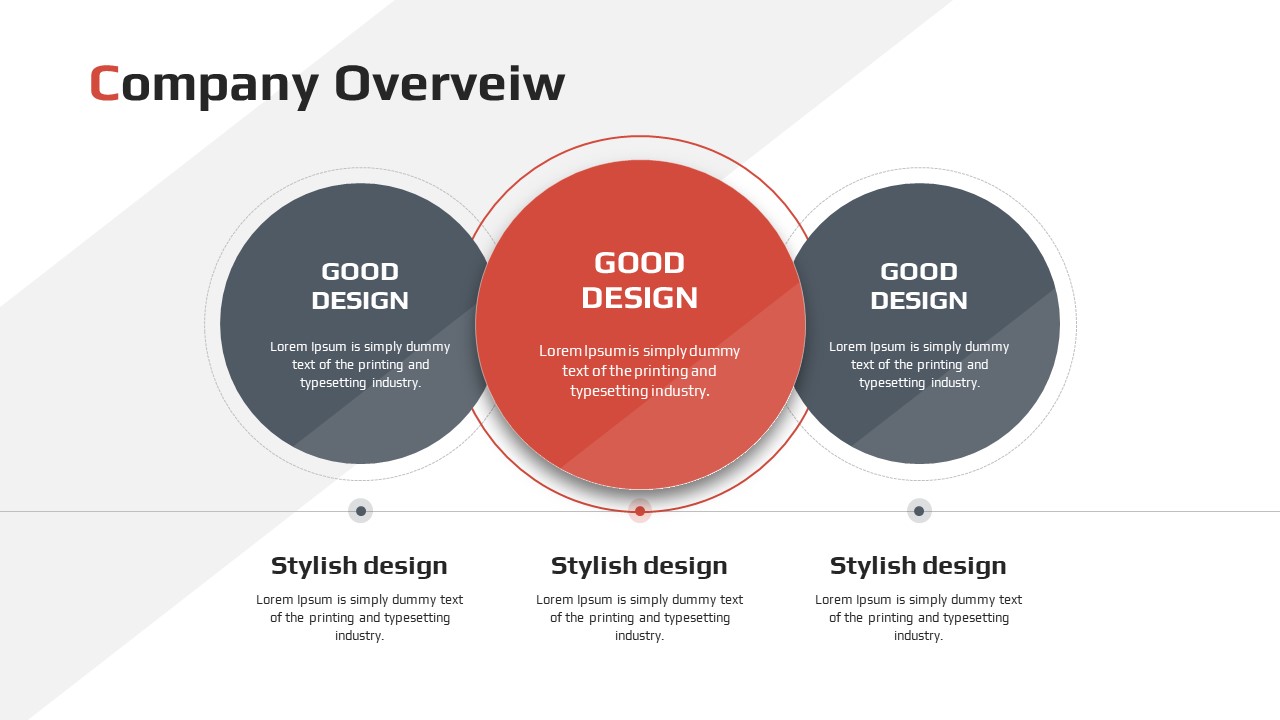
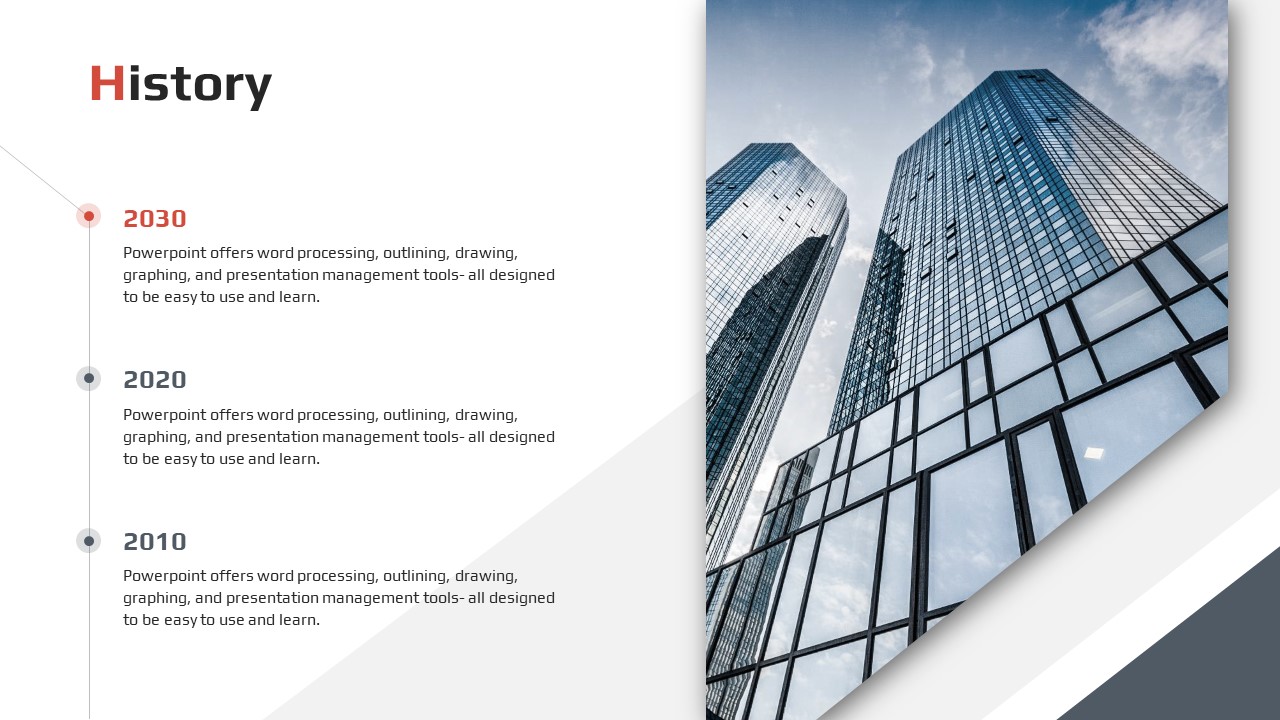
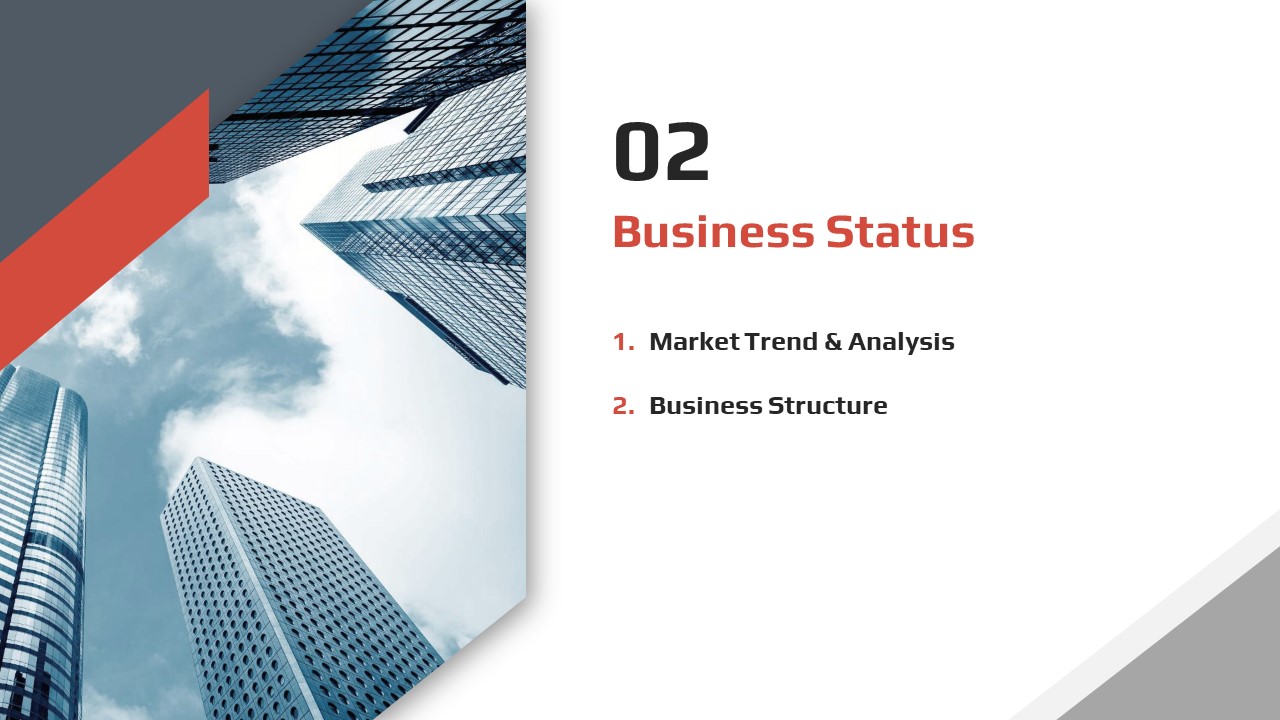
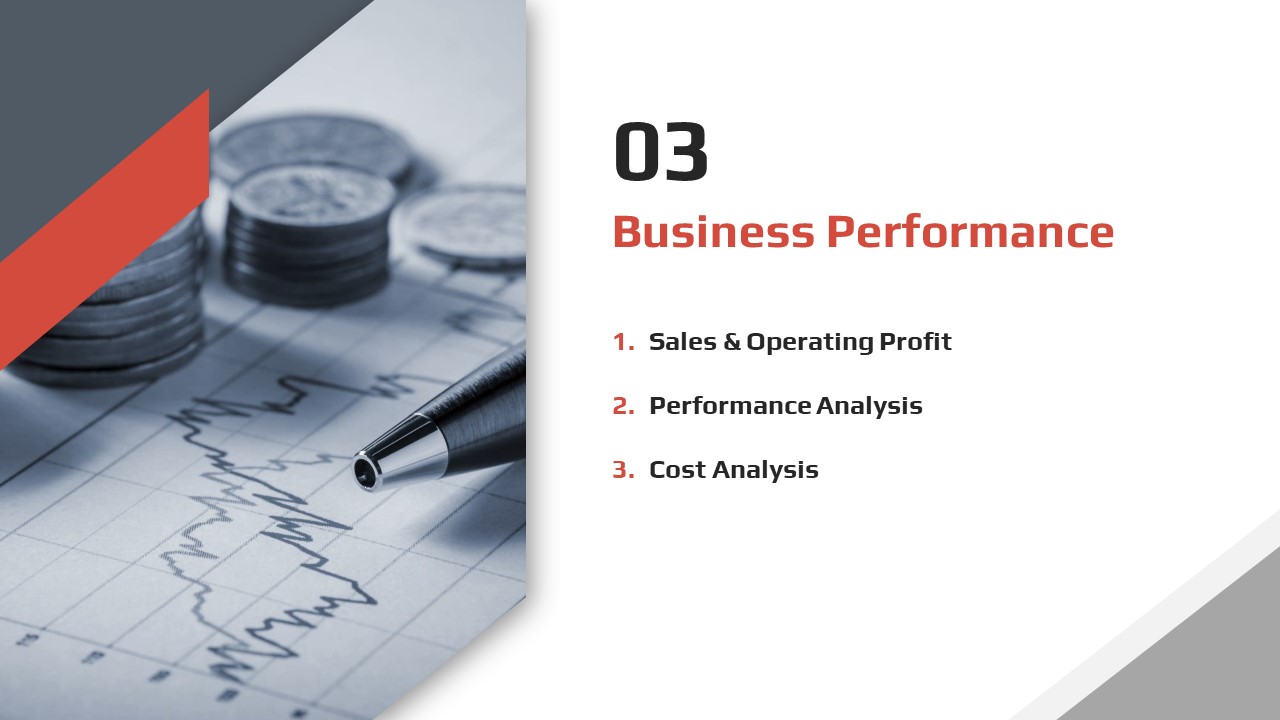
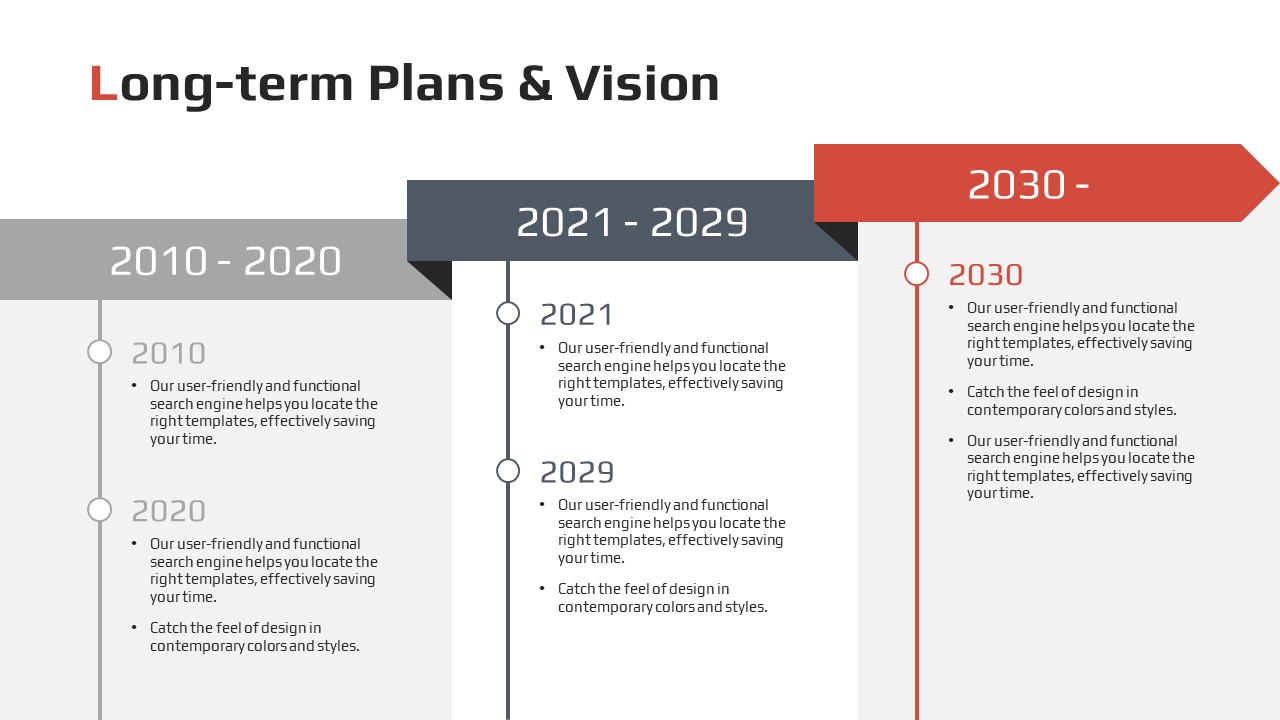
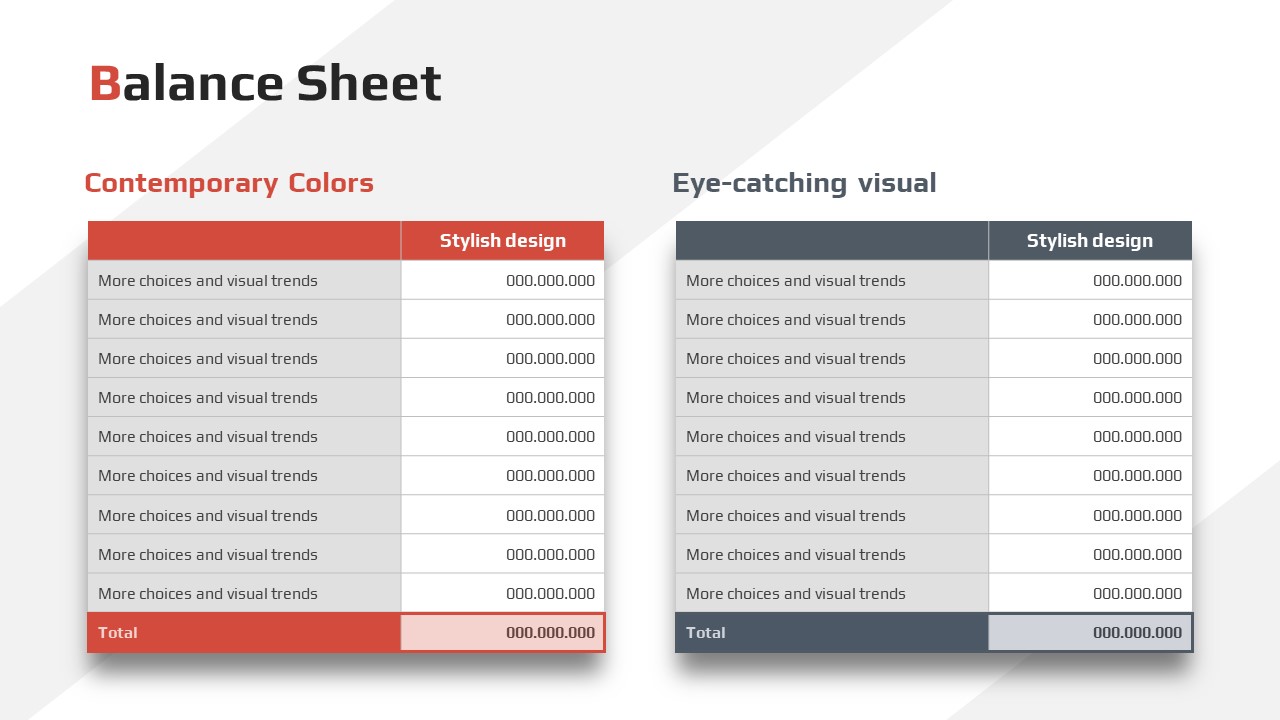
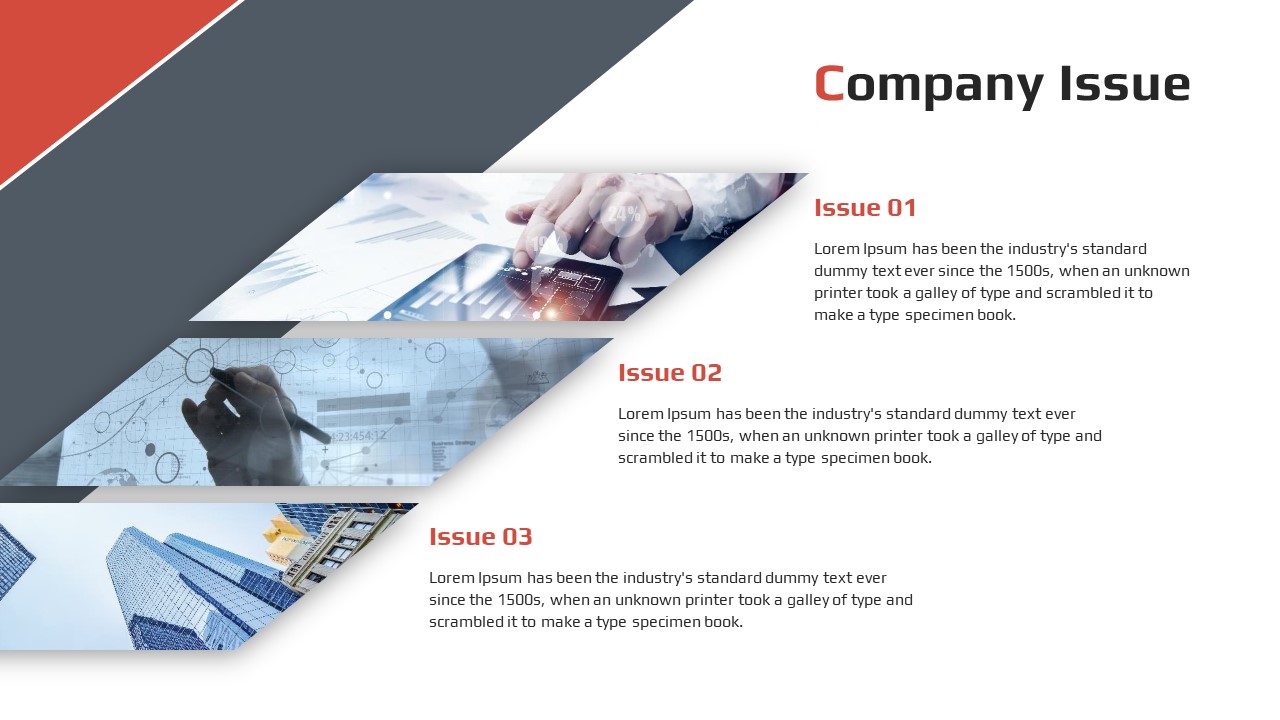
33 slides total: Title slide → Company Overview (cluster circle diagram) → Business Structure (3-circle cluster diagram) → Section divider (number + red subheading + sub-items) → IR Team Contact Info (6-person profile card grid) → Constitution of Shareholders (donut chart with 60%, 25%, 15% breakdown) → Performance Analysis (vertical bar graph, 2015–2030 trend) → Business Performance section (Sales & Operating Profit, Performance Analysis, Cost Analysis subsections).
Related Products
-

Modern IR PPT Template – Professional and Sleek Design
#Investor Relations/IR
-

Pitch Deck Template | The 4-Step AI Startup IR Deck That Gets Investors to Say Yes in 5 Seconds
#Investor Relations/IR
-

Modern IR Vertical Template - Elegant Design and Effective Structure
#Investor Relations/IR
-

Architecture Presentation Strategy Vertical Template – Stylish Design
#Investor Relations/IR
