Competitive Business Overview Diagram
RM0600005_4
- Last Update 02/24/2025
- File Size 0.3MB
- # of Slides 2
- File Format PPTX
- Slide Ratio 16:9
- Color
Keywords
- #Content-Based Slides
- #Design-Based Slides
- #Company Introduction
- #Business Vision and Strategy
- #Diagram
- #Company Overview
- #Core Competencies
- #Cluster
- #Combination Diagram
- #Chain Diagram
- #16:9
- #cluster diagram PowerPoint
- #connected diagram slide template
- #3-node comparison slide
- #central emphasis diagram
- #business overview PPT slide
About the Product
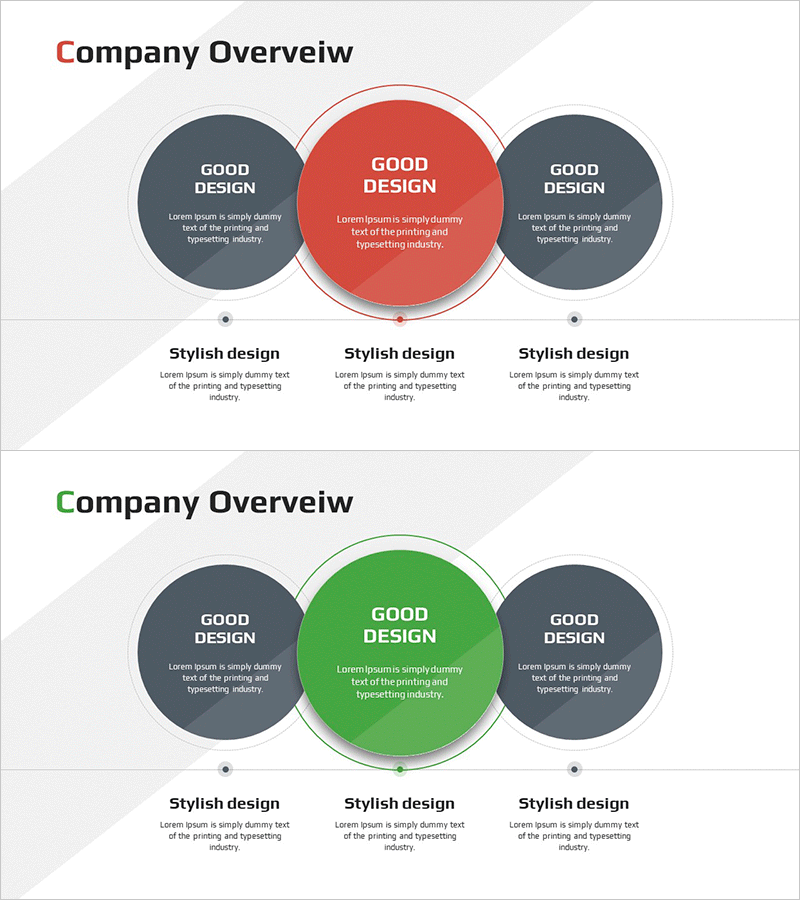
A cluster diagram PowerPoint slide that emphasizes a central element and visualizes relationships with surrounding components. This 2-slide set features red and green color versions, with each node containing independent text areas. Dark gray side nodes and a central highlighted circle are connected through an overlapping effect, making it ideal for business strategy, competitive analysis, and core competency comparison presentations. Optimized for 16:9 widescreen format in fully editable PPTX.
Usage Points
-
Main Usage
Used to clearly express relationships between a central element and surrounding components in company overviews, business strategies, and competitive analyses. The emphasized central circle highlights key messages or core competencies, while side nodes accommodate supporting information or comparison items.
-
How to Use
Double-click each circular node's text area to enter title and description text. Place your core message in the central red or green circle and related items in the left and right dark gray circles. Select the color version that matches your presentation theme or corporate branding.
-
Recommended For
Recommended for executive reports, business plan presentations, product introduction decks, marketing strategy meetings, and organizational capability analysis materials. Particularly suitable for B2B business documents that need to compare three key elements or emphasize relationships with a central topic.
-
Slide Structure
2-slide composition with slide 1 featuring the red-centered version and slide 2 the green-centered version. Each slide contains one central emphasized circle (approximately 40% diameter) and two supporting circles on left and right (approximately 30% diameter each), connected through an overlapping effect. Each node accommodates one title line and 2-3 lines of descriptive text.
Related Products
-

Business Core Competency Overlay Diagram – Effective Strategy Delivery
#Product/Service Introduction #Business Vision and Strategy #Diagram
-

Research and Development Overview Diagram – Innovation and Progress
#Company Introduction #Product/Service Introduction #Diagram
-

Visualizing Marketing Strategies with Triangular Diffusive Connecting Elements
#Business Vision and Strategy #Marketing Plan and Strategy #Diagram
-

Core Technology Characteristics Diagram – Strategic Analysis
#Product/Service Introduction #Business Vision and Strategy #Diagram
