Service Composition and Strategy Diagram – Business Vision and Marketing Strategy
RM0600005_20
- Last Update 02/24/2025
- File Size 0.3MB
- # of Slides 2
- File Format PPTX
- Slide Ratio 16:9
- Color
Keywords
- #Content-Based Slides
- #Design-Based Slides
- #Business Vision and Strategy
- #Marketing Plan and Strategy
- #Diagram
- #Core Competencies
- #Marketing Strategy
- #Flow
- #Cluster
- #Circular Flow
- #Chain Diagram
- #16:9
- #circular diagram PowerPoint
- #3-node connection diagram
- #business strategy flowchart slide
- #service composition diagram PPT
- #marketing strategy PowerPoint template
About the Product
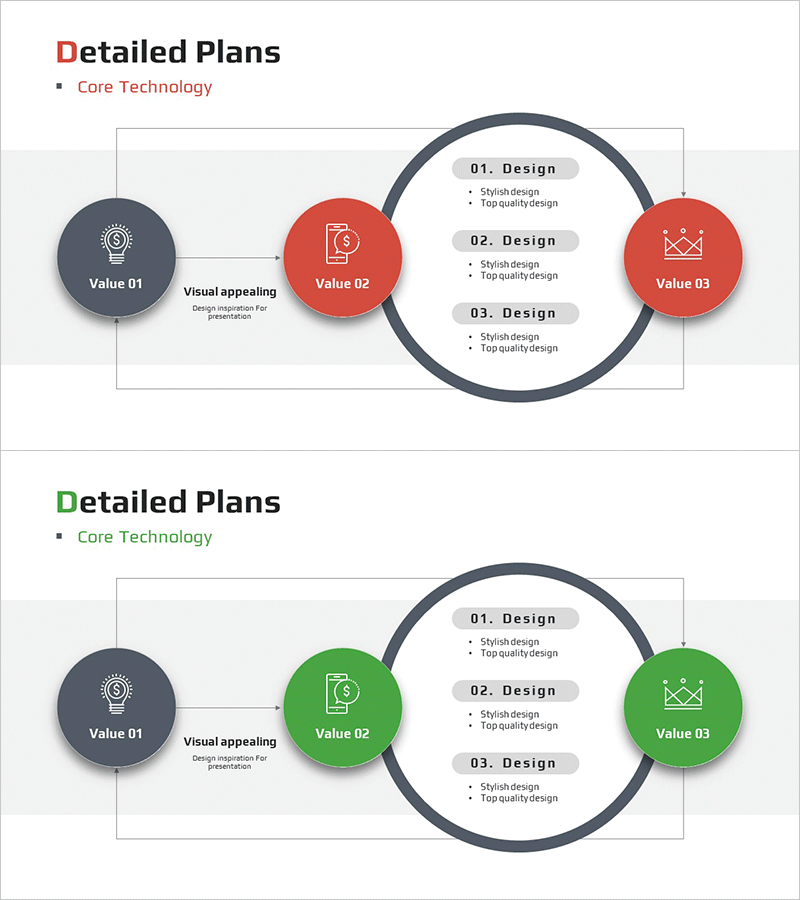
A three-stage circular connection diagram PowerPoint slide that visualizes business vision and marketing strategy. The flow begins at the left dark-gray node, progresses through the center red node, and continues to the right red node, with a circular arrow returning to the starting point. The central circular area contains three text boxes for listing design elements, making it ideal for explaining service composition, strategic phases, and marketing plans step-by-step. Delivered as 2 slides in 16:9 widescreen format in editable PPTX.
Usage Points
-
Main Usage
Visualize business strategy, service composition, and marketing plans as a three-stage circular flow to clearly communicate the entire business process to your audience. Input core values in each node and add detailed design elements in the central circular area to represent multi-layered information structure.
-
How to Use
Enter initial value (e.g., customer needs) in the left dark-gray node, core value (e.g., service delivery) in the center red node, and final value (e.g., customer satisfaction) in the right red node. Describe stage-specific design elements in the three text boxes within the central circle to explain concrete implementation strategies.
-
Recommended For
Ideal for executive reports, investor presentations, strategic planning meetings, new business proposals, and marketing strategy sessions where business processes and strategic flows need to be explained. Commonly used by consulting firms, marketing teams, strategic planning departments, and new business development teams.
-
Slide Structure
2-slide set featuring three circular nodes (left dark-gray, center red, right red) connected by directional arrows, with three text boxes positioned in the central circular area. Formatted in 16:9 widescreen for optimal display on projectors and online presentations.
Related Products
-

Core Triangle Connection Diagram – Business Vision and Marketing Strategy
#Business Vision and Strategy #Marketing Plan and Strategy #Diagram
-

Key Strategies for Vaccine Success – Effective Marketing and Vision
#Business Vision and Strategy #Marketing Plan and Strategy #Diagram
-

Business Support Plan Diagram – Overcoming and Innovation
#Operational Plan #Marketing Plan and Strategy #Diagram
-

Strategic Component Circular Flow – Vision and Marketing Strategy
#Business Vision and Strategy #Marketing Plan and Strategy #Diagram
