Asset, Capital Structure Analysis Table - An Effective Tool for Financial Planning
RM0600005_26
- Last Update 02/24/2025
- File Size 0.3MB
- # of Slides 2
- File Format PPTX
- Slide Ratio 16:9
- Color
Keywords
About the Product
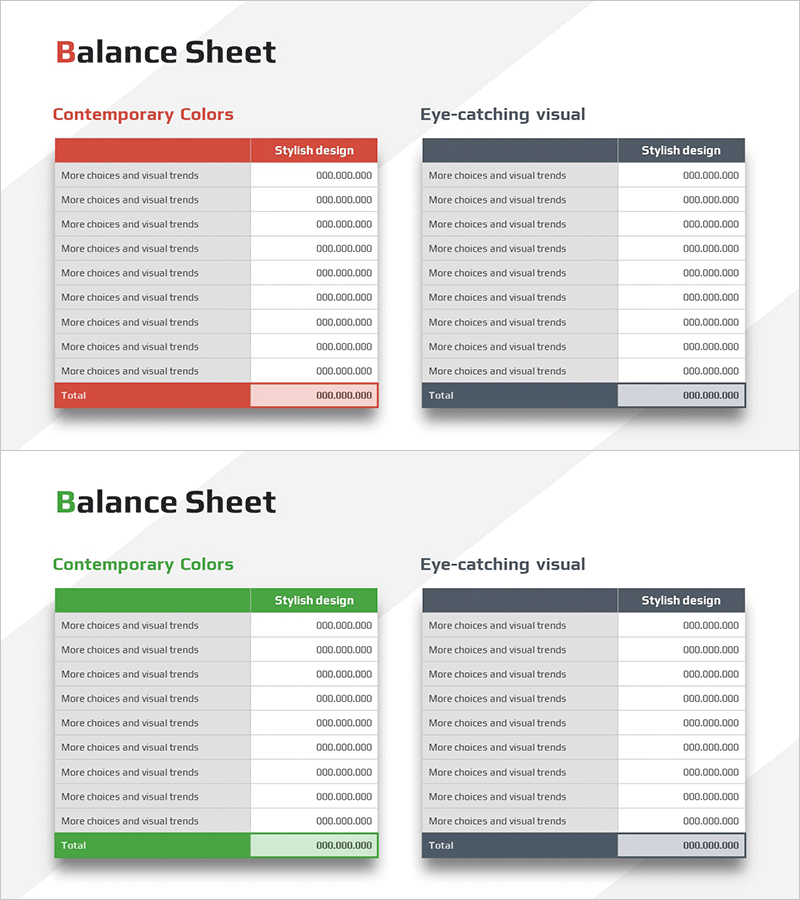
A professional balance sheet PowerPoint slide designed for financial analysis and asset-capital structure comparison. Available in three color schemes—red, green, and gray—each slide features a side-by-side dual-panel layout for effective comparative visualization. The table structure includes 10 data rows plus a total row, enabling easy input of financial figures and immediate use in presentations. Delivered in 16:9 widescreen PPTX format, fully editable across all PowerPoint versions.
Usage Points
-
Main Usage
A specialized slide for financial statement preparation and asset-capital structure analysis. The side-by-side dual-panel layout enables effective comparative analysis, while 10 data rows accommodate detailed financial information. Ideal for investor presentations, financial reports, and business plans to communicate key financial metrics with high readability.
-
How to Use
Simply enter asset, liability, and equity items with corresponding figures into the table cells. Select the color scheme—red, green, or gray—that matches your corporate branding, and freely add, remove, or modify line items and values as needed. You can also insert charts or additional text boxes without restrictions.
-
Recommended For
Best suited for finance teams, CFOs, and investor relations professionals presenting financial status. Highly effective in business plans, investor presentations, quarterly financial reports, and bank loan applications where clear asset-liability-equity structure visualization is essential.
-
Slide Structure
Two-slide set, each containing a title area plus two comparison tables (left and right). Each table has 10 data rows plus 1 total row, allowing flexible input of line items and numerical values. Color-coded headers (red, green, gray) provide clear visual distinction between sections.
Related Products
-

Last Year's Sales Comparison Analysis Table – Visually Representing Financial Performance
#Financial Plans and Performance #Diagram #Balance Sheet
-

Modern Simple Balance Sheet – Intuitive and Sleek Financial Slide
#Financial Plans and Performance #Diagram #Balance Sheet
-

Clothing Business Balance Sheet – Blueprint and Practicality
#Financial Plans and Performance #Diagram #Balance Sheet
-

Diagram Table Slide for Financial Performance Analysis
#Financial Plans and Performance #Diagram #Balance Sheet
