Sales and Profit Growth Trend Analysis Graph – Market and Financial Performance
RM0600005_12
- Last Update 02/24/2025
- File Size 0.3MB
- # of Slides 2
- File Format PPTX
- Slide Ratio 16:9
- Color
Keywords
- #Content-Based Slides
- #Design-Based Slides
- #Market and Competitor Analysis
- #Financial Plans and Performance
- #Graph
- #Other
- #Market Analysis
- #Sales and Revenue
- #16:9
- #sales profit growth chart PowerPoint
- #financial analysis slide
- #bar chart presentation
- #sales trend analysis slide
- #profit growth visualization PPT
About the Product
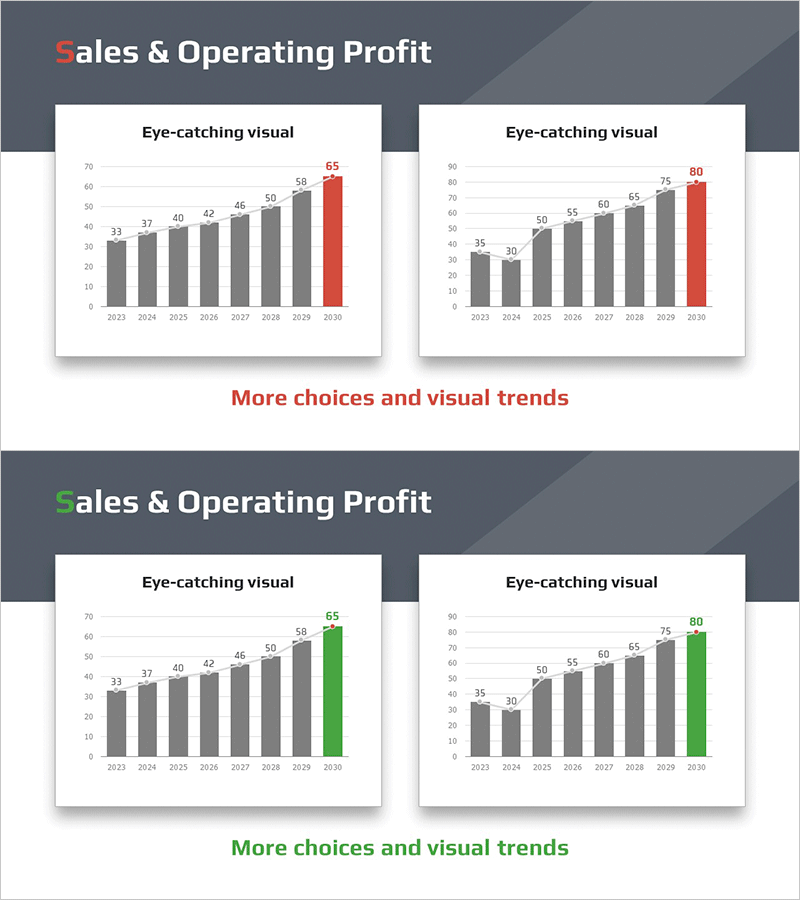
A PowerPoint slide that visualizes sales and profit growth trends using two side-by-side bar charts. The slide displays year-over-year data from 2023 to 2030, with the final year highlighted in accent colors (red and green) to emphasize performance achievement. Optimized for 16:9 widescreen format, this slide is ready for immediate use in conference rooms and online presentations. Perfect for financial performance reports, investor presentations, business plans, and any presentation requiring data-driven decision support and revenue analysis.
Usage Points
-
Main Usage
Communicate financial performance and sales growth to investors, employees, and partners through data-driven visualization. The ascending bar trends and accent colors clearly convey business achievement and projected performance targets.
-
How to Use
Insert into investor presentations, business plans, quarterly or annual performance reports in the financial section. Edit the numbers and years to match your company's actual data, and use color highlighting to emphasize key performance metrics.
-
Recommended For
CFOs, finance managers, executives, and investor relations professionals presenting financial results. Ideal for startup fundraising pitches, corporate earnings announcements, business proposals, and any presentation requiring quantitative decision-making support.
-
Slide Structure
Two-slide layout featuring two bar charts positioned side-by-side on each slide. Title area at the top, year-by-year numerical labels at the bottom, with the final year bar highlighted in red or green to visually emphasize target achievement.
Related Products
-

Sales and Profit Analysis Chart – Data Driven Insights
#Market and Competitor Analysis #Financial Plans and Performance #Diagram
-

Graph Comparing Performance by Major Business Divisions - Efficient Financial Planning
#Market and Competitor Analysis #Financial Plans and Performance #Graph
-

Bar Graph of Comparative Analysis of Operating Profit
#Market and Competitor Analysis #Financial Plans and Performance #Graph
-

Regional Demand Survey Graph – Key to Market Analysis
#Market and Competitor Analysis #Financial Plans and Performance #Graph
