Profit and Loss Analysis Table Chart – Visualizing Financial Performance
RM0600005_25
- Last Update 02/24/2025
- File Size 0.3MB
- # of Slides 2
- File Format PPTX
- Slide Ratio 16:9
- Color
Keywords
- #Content-Based Slides
- #Design-Based Slides
- #Financial Plans and Performance
- #Diagram
- #Income Statement
- #Cash Flow Statement
- #Table
- #16:9
- #income statement PowerPoint slide
- #profit and loss table slide
- #financial performance visualization PPT
- #how to create an income statement in PowerPoint
- #financial data table template
About the Product
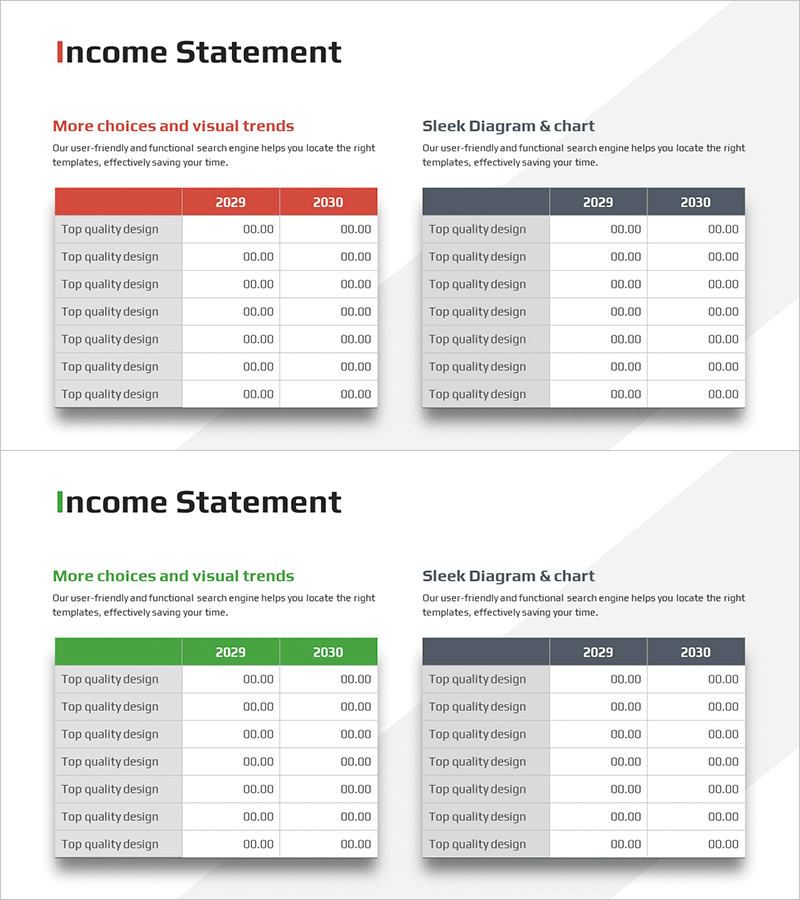
A professional income statement PowerPoint slide designed to visualize financial performance with clarity and impact. This 2-slide set offers red and green color options, each featuring a structured table with 7 financial line items and data columns for 2029 and 2030. The layout divides each slide into a left section for descriptive text and a right section for the financial table, enabling simultaneous presentation of narrative context and quantitative data. Ideal for investor presentations, financial reports, and business plan decks where income statement analysis is critical.
Usage Points
-
Main Usage
Clearly visualize corporate income statement data through a structured financial table, enabling investors, executives, and stakeholders to grasp financial performance at a glance. Year-over-year comparison reveals financial trends and performance trajectory.
-
How to Use
Insert this slide into the financial section of investor presentations, annual reports, or business plans. Select your preferred color option (red or green), then edit the line item labels and numerical values in the table. The slide is immediately ready for presentation after data entry.
-
Recommended For
CFOs, financial managers, investor relations professionals, and executives presenting financial results. Particularly effective for quarterly and annual earnings announcements, investor briefings, board meetings, and internal financial reviews where income statement clarity is essential.
-
Slide Structure
2-slide set. Each slide contains a title area, a left text section for narrative explanation, and a right financial table with 7 rows (line items) and 3 columns (item name, 2029, 2030). Table headers are color-coded; data rows feature white backgrounds for easy editing.
Related Products
-

Activity Time & Calorie Burn Table – Structure for Financial Performance
#Financial Plans and Performance #Diagram #Income Statement
-

Income Statement Table by Year
#Financial Plans and Performance #Diagram #Income Statement
-

Income Statement Table – Visualizing Financial Performance
#Financial Plans and Performance #Diagram #Income Statement
-

Balloon Pile Table Chart – Communicating Financial Performance
#Financial Plans and Performance #Diagram #Income Statement
