Core Business & Operating Model Diagram – Visualization of Business Structure
RM0600005_10
- Last Update 02/24/2025
- File Size 0.3MB
- # of Slides 2
- File Format PPTX
- Slide Ratio 16:9
- Color
Keywords
- #Content-Based Slides
- #Design-Based Slides
- #Business Introduction
- #Business Vision and Strategy
- #Diagram
- #Business Overview
- #Cluster
- #Chain Diagram
- #16:9
- #connected diagram PowerPoint
- #business structure slide
- #3-node diagram template
- #business model visualization
- #operating model diagram
- #presentation diagram PowerPoint
About the Product
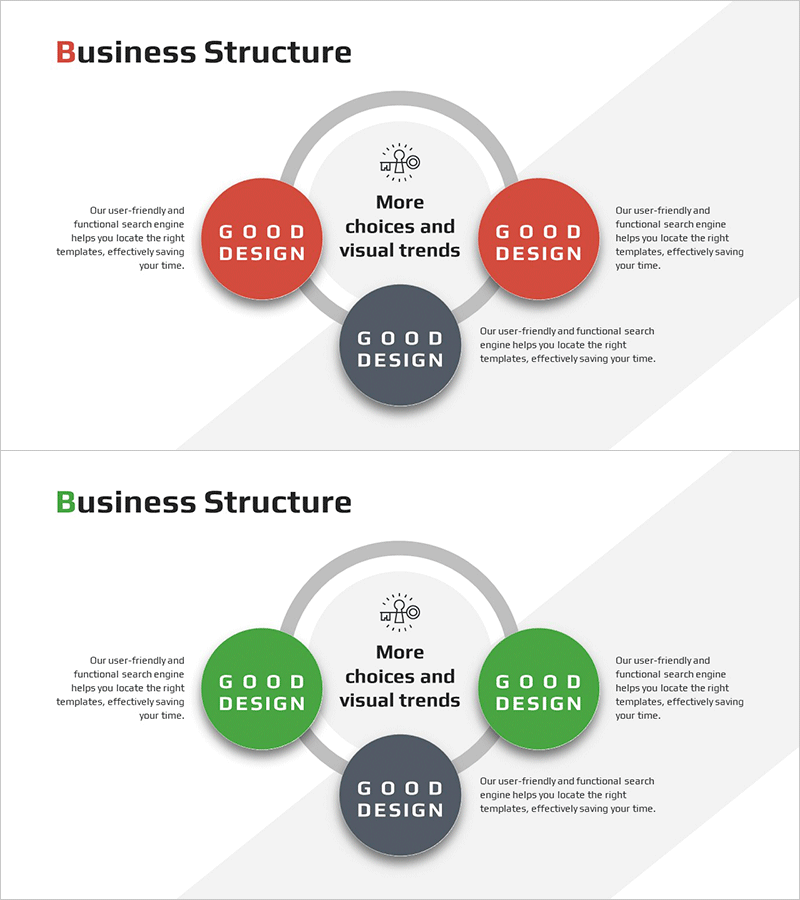
A PowerPoint slide that visualizes business structure and operating model through three interconnected nodes. The design features a central gray node connected to two upper-side red nodes via circular arrows, representing cyclical relationships. Each node contains editable text areas for key messages, with an icon and title section positioned at the top center. This presentation slide effectively illustrates the mutual relationships between three core business elements such as company strategy, business model, and operational system. Provided in 2-slide 16:9 PPTX format with fully customizable colors and text for immediate use in corporate presentations.
Usage Points
-
Main Usage
Visualizes the interconnected relationships between core business elements, operating models, and strategic frameworks using three nodes, enabling stakeholders to grasp complex business structures at a glance. Ideal for investor presentations, executive briefings, and organizational restructuring announcements where clear communication of business architecture is essential.
-
How to Use
Enter your company's core business, operational approach, and strategic objectives into each node's text area. Add your presentation title in the top center section and adjust colors as needed for emphasis. The circular arrows represent cyclical relationships, making this layout perfect for elements that have mutual influence or interdependencies.
-
Recommended For
Executives, business strategists, management consultants, investment professionals, and marketing managers presenting business strategies, organizational structures, and business models. Particularly effective when emphasizing the balance and interaction between three key business components.
-
Slide Structure
2-slide set. First slide features two red nodes plus one gray node in a 3-node connected structure. Second slide presents the same layout with two green nodes plus one gray node, providing color variation options. Each node is circular with editable text areas, icon space at top center, and circular arrows connecting nodes to represent cyclical relationships.
Related Products
-

Business Area Overlap Diagram – Integration of Strategy and Vision
#Business Introduction #Business Vision and Strategy #Diagram
-

Business Overview and Goals – Blue, Orange, Green Cluster Design
#Business Introduction #Business Vision and Strategy #Diagram
-

Drug Addiction Treatment Analysis Diagram
#Business Introduction #Business Vision and Strategy #Diagram
-

Business and Service Overview Semicircle Diagram
#Product/Service Introduction #Business Introduction #Business Vision and Strategy
