Achievements Timeline Diagram – Business Vision and Strategy
RM0600005_18
- Last Update 02/24/2025
- File Size 0.3MB
- # of Slides 2
- File Format PPTX
- Slide Ratio 16:9
- Color
Keywords
- #Content-Based Slides
- #Design-Based Slides
- #Company Introduction
- #Business Vision and Strategy
- #Diagram
- #History
- #Business Vision
- #Flow
- #Cluster
- #Linear Flow
- #Chain Diagram
- #16:9
- #timeline diagram PowerPoint
- #business vision slide template
- #company history timeline PPT
- #strategic roadmap diagram
- #4-stage timeline slide
About the Product
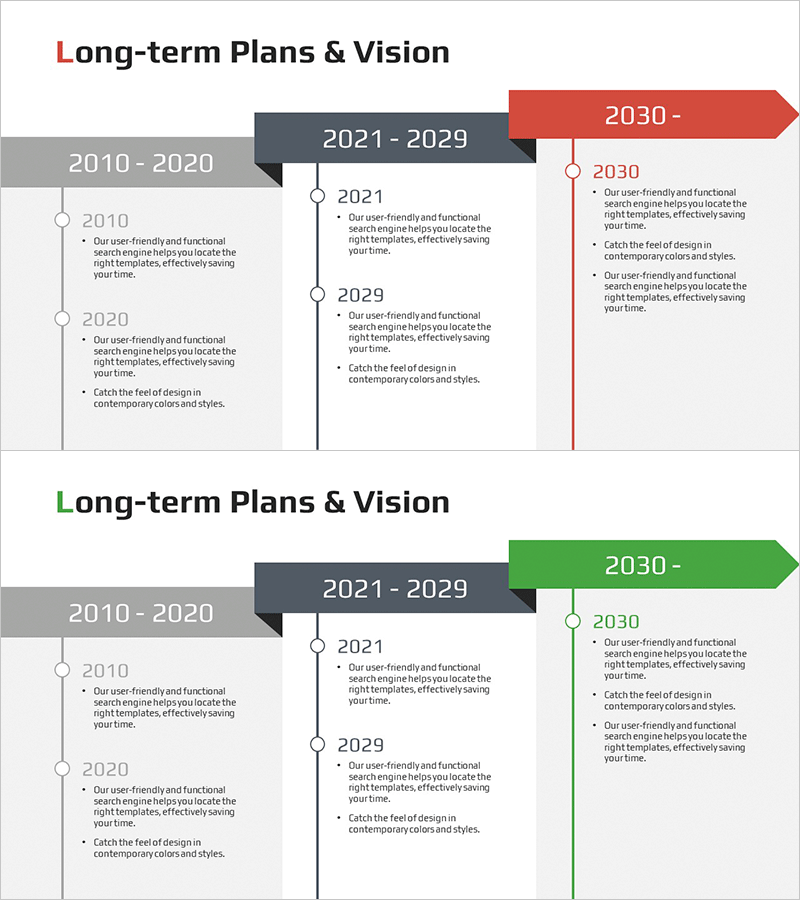
A timeline diagram PowerPoint slide that visualizes your company's long-term vision and strategy across four key periods from 2010 to 2030. The arrow-connected structure clearly shows the progression of goals and achievements at each stage, making it ideal for presenting business growth trajectories and future plans. The design uses a neutral gray and black palette with accent colors (red and green) to emphasize the flow of time and directional focus. Perfect for business presentations, strategic reports, and investor pitches that require clear visualization of organizational evolution and forward-looking objectives.
Usage Points
-
Main Usage
Communicate your company's long-term vision and strategic direction by presenting achievements and milestones across distinct time periods. The visual timeline structure helps stakeholders understand the continuity from past accomplishments to future goals, making complex strategic narratives clear and compelling.
-
How to Use
Fill in each time period node with years, milestones, key achievements, and strategic objectives. Use this slide in investor presentations, employee onboarding sessions, strategic planning meetings, and annual business reviews to explain corporate vision, growth trajectory, and future direction with visual clarity.
-
Recommended For
Executives, business development teams, marketing departments, and strategic planning units presenting company vision, business strategy, and organizational growth plans. Ideal for investor relations presentations, employee training sessions, organizational restructuring announcements, and long-term business planning communications.
-
Slide Structure
Two-slide set featuring red and green accent color versions. Each slide contains a linear timeline with 4 connected nodes representing key periods (2010-2020, 2021-2029, 2030-), with 3-4 text input areas per node for detailed information entry and customization.
Related Products
-

History Vertical Arrow Diagram – Business Flow Visualization
#Company Introduction #Diagram #History
-

Social Media Linear Diagram – Stages of Business Growth
#Company Introduction #Business Strategy #Diagram
-

Oriental Medicine Business Area Diagram – Visualization of Vision and Strategy
#Company Introduction #Business Vision and Strategy #Diagram
-

Adventure Company History 4 Color Connection Diagram
#Company Introduction #Business Strategy #Diagram
