
The Prevention of Female Disease Education PPT – Design to Raise Health Awareness
J0500028
- Last Update 11/30/2024
- File Size 9.5MB
- # of Slides 30
- File Format PPTX
- Slide Ratio 16:9
- Color
Slide Preview


Keywords
About the Product
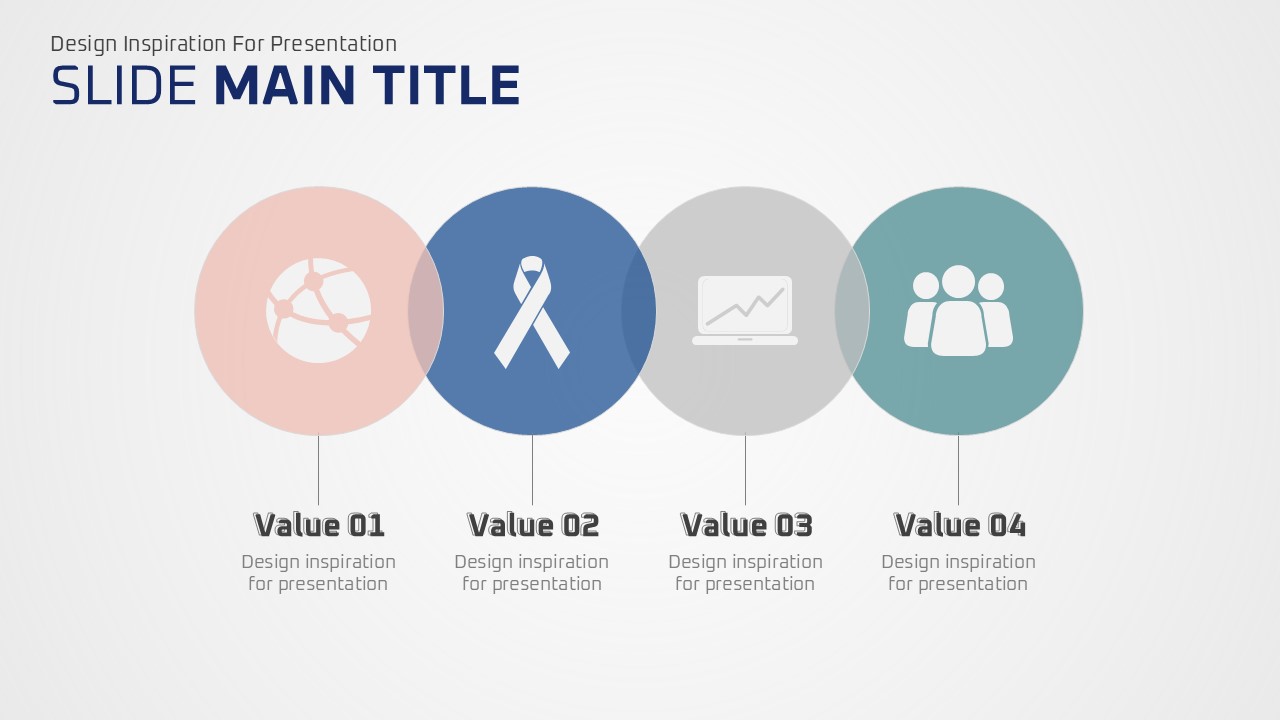
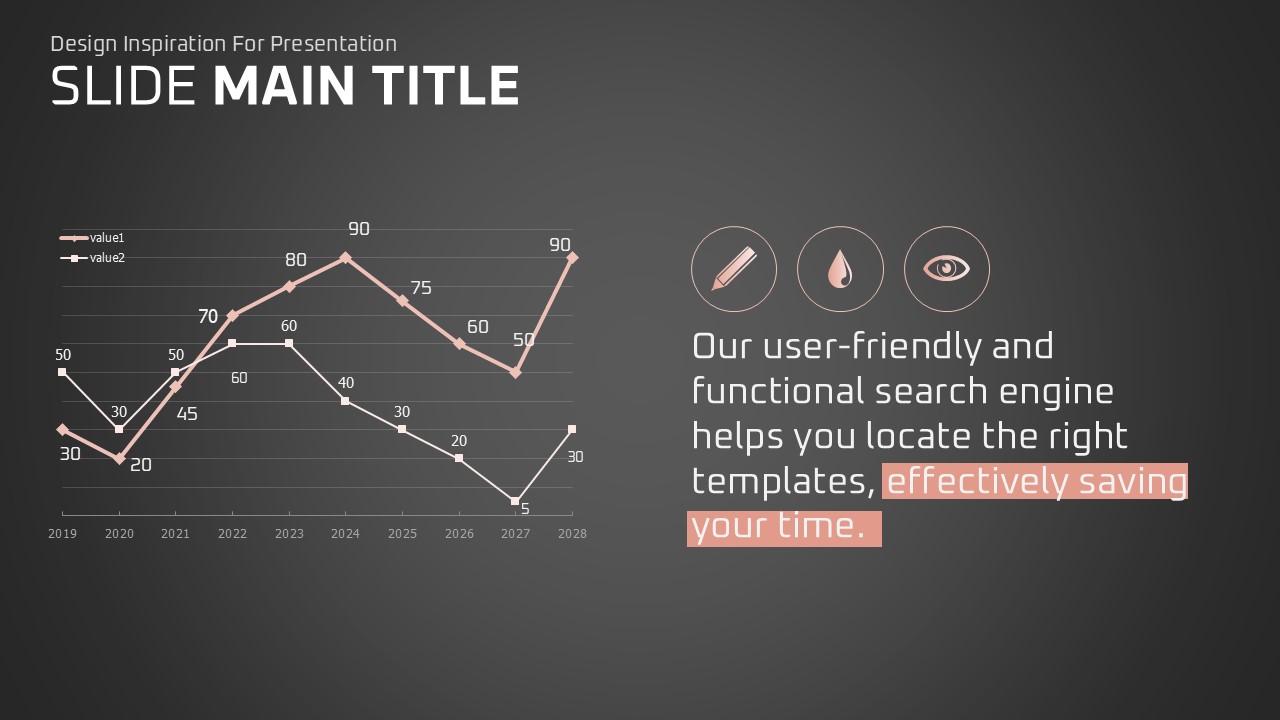
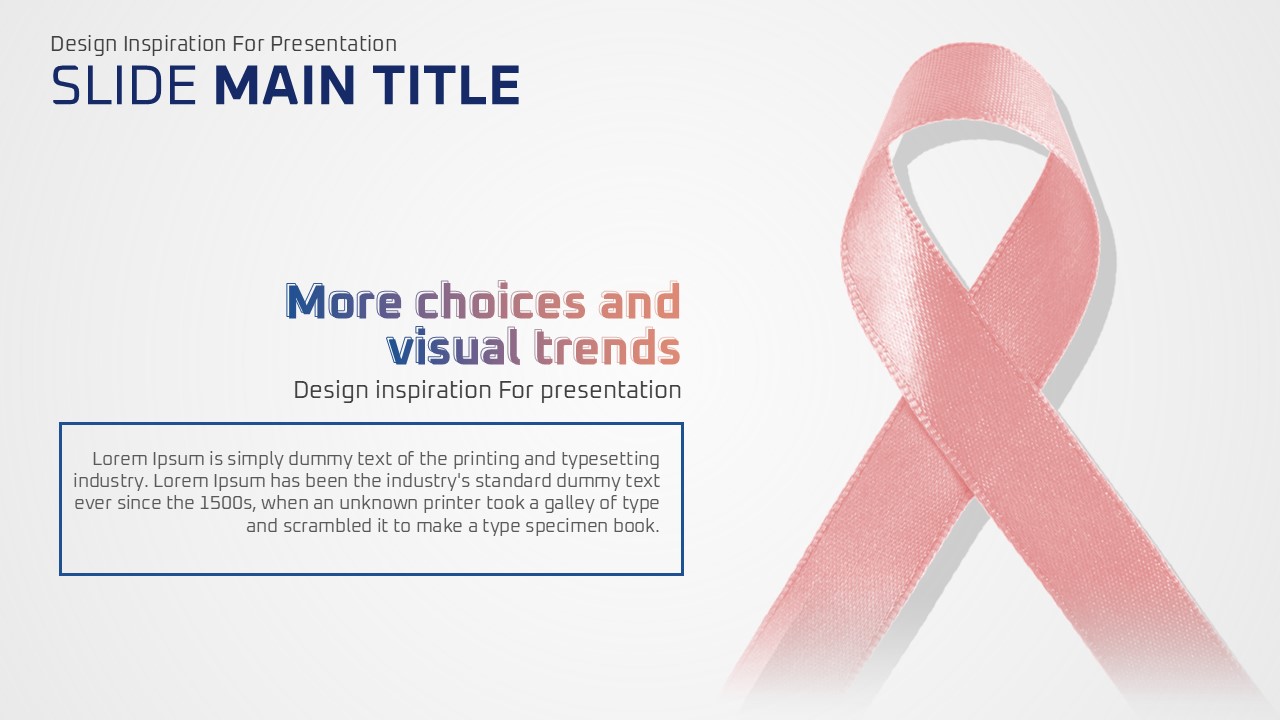
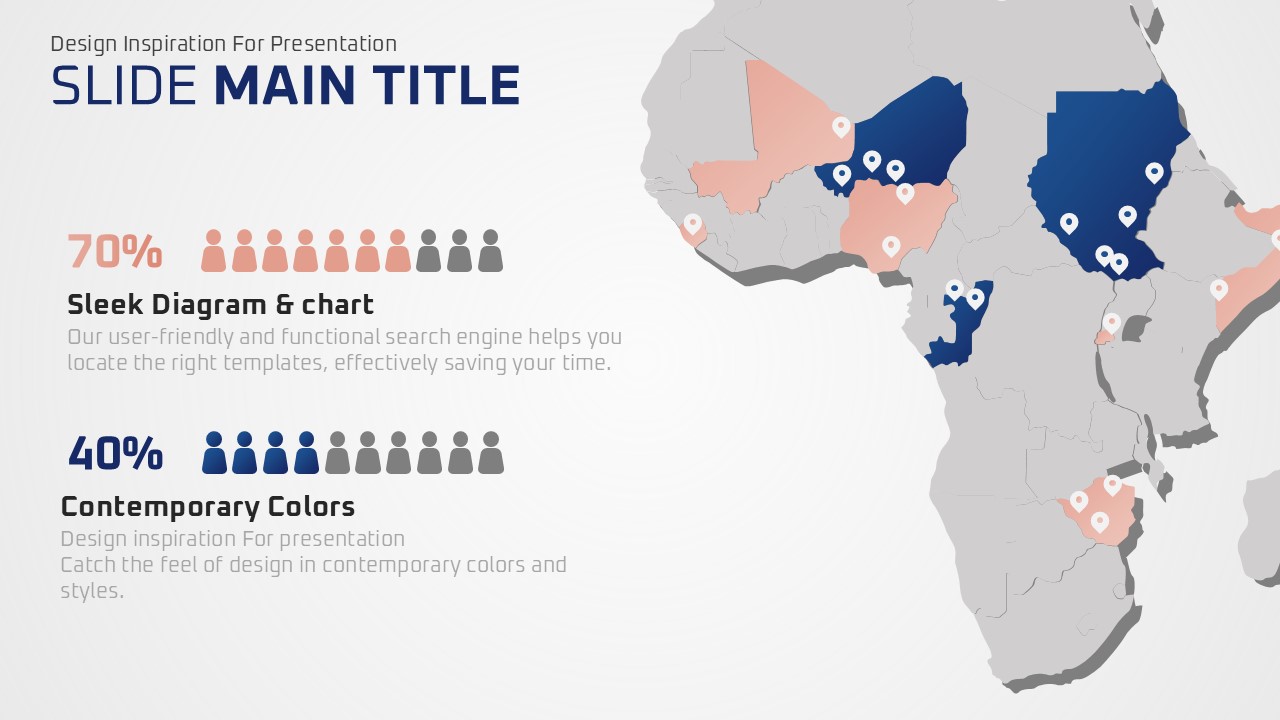
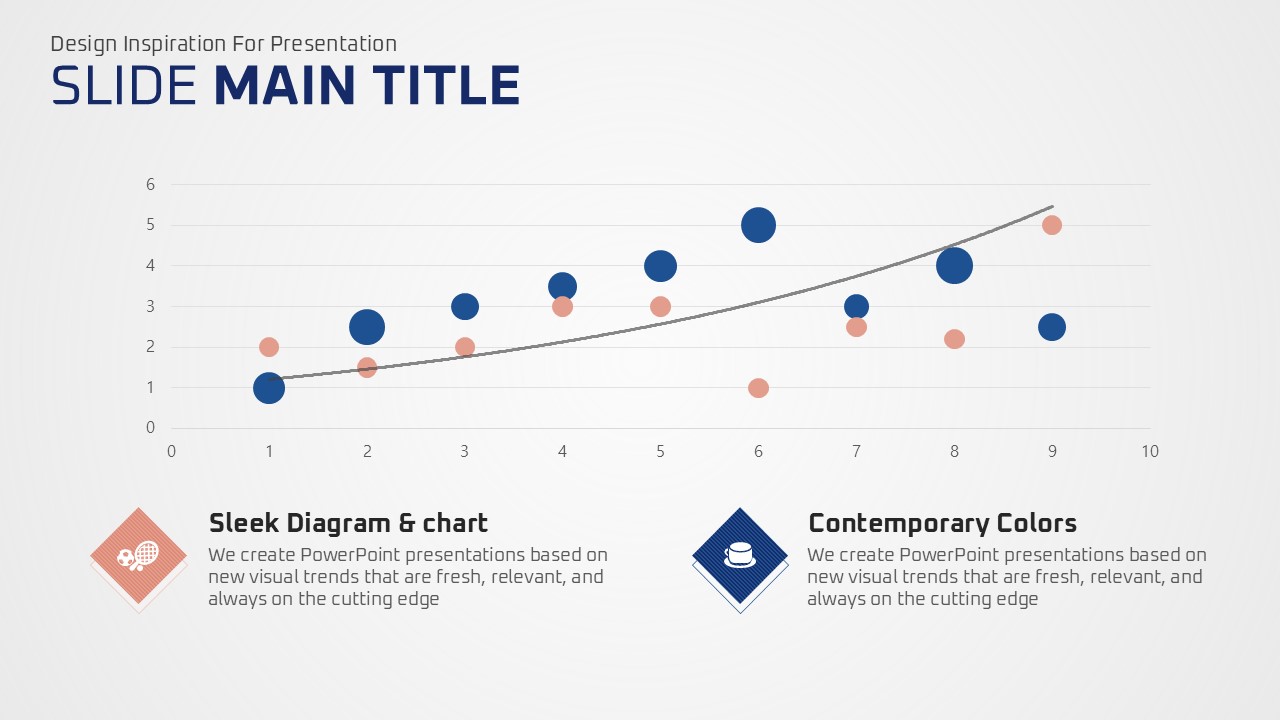
A 30-slide PowerPoint template designed specifically for female disease prevention education and women's health awareness campaigns. The deck features a light gray background with navy blue as the primary color and coral/salmon pink as accent, creating a trustworthy yet approachable tone ideal for medical and healthcare presentations. Slide types include donut charts for percentage comparisons, a female body silhouette diagram with labeled callouts, a world map data visualization with regional bubble statistics, and a dark-background line graph with icon sets — giving presenters a full toolkit for data-driven health education. The balanced layout integrates text, charts, and infographics across all slides, making complex medical information easy to understand. Delivered in 16:9 widescreen PPTX format, all elements are fully editable to match your organization's branding. Ideal for hospitals, public health centers, universities, and NGOs delivering women's health seminars, lectures, or awareness programs.
Usage Points
-
Main Usage
Designed for female disease prevention lectures, women's health awareness campaigns, and medical seminars where statistical data and anatomical diagrams need to be communicated clearly to a general or professional audience.
-
How to Use
Download the PPTX file and open it in PowerPoint or a compatible application. Replace placeholder text and numerical values in charts with your own data. Colors and fonts can be adjusted to align with your institution's visual identity.
-
Recommended For
Healthcare educators, hospital public health teams, university health science instructors, NGO program coordinators, and government public health officers who deliver women's health education sessions or awareness presentations.
-
Slide Structure
30 slides including a title cover, donut chart slide (4-item percentage comparison), female body silhouette diagram, world map with regional data bubbles, dark-background line graph with icon callouts, and supporting text-and-icon layout slides.
Related Products
-

Creative Presentation Wide – Perfect for Educational and Creative Presentations
#Education
-

Cute Orchestra Illustration Presentation Template – Optimized for Music Education
#Education
-

Homework PowerPoint Wide Template – Ideal Design for Education
#Education
-

Fashion Design Presentation Template – Creative and Stylish Wide Layout
#Education
