Pie Type Analysis Page – Business Operations Strategy
RJ0500028_6
- Last Update 06/14/2025
- File Size 0.2MB
- # of Slides 2
- File Format PPTX
- Slide Ratio 16:9
- Color
Keywords
- #Content-Based Slides
- #Design-Based Slides
- #Business Introduction
- #Operational Plan
- #Graph
- #Business Overview
- #Organizational Structure and Staffing Plan
- #Circles
- #Pie Chart
- #16:9
- #pie chart PowerPoint slide
- #4-segment analysis chart
- #business operations strategy PPT
- #circular graph template
- #data visualization slide
About the Product
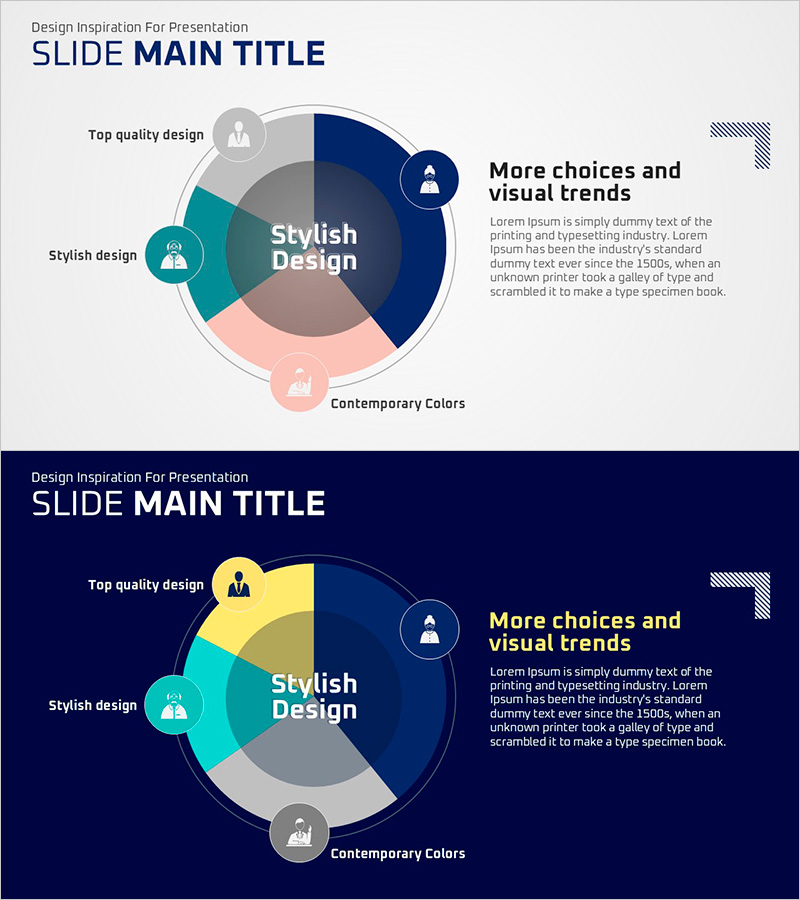
A 4-segment pie chart PowerPoint slide designed to visualize business operations strategy and organizational planning. The circular chart features navy, teal, pink, and gray segments with icons and labels positioned around the center circle, making data proportions immediately clear. Two slide layouts are included: one with a light gray background and one with a dark navy background, allowing you to match your presentation environment. The 16:9 widescreen PPTX format enables quick editing of segment colors, icons, and text labels to fit your specific content needs.
Usage Points
-
Main Usage
Ideal for presenting four key components of organizational planning, operational strategy, or business overview where proportional relationships matter. The centered circular structure with icons and text labels ensures each segment's meaning is immediately understood by your audience.
-
How to Use
Select either the light gray or dark navy background version based on your presentation environment and projector settings. Double-click each segment, icon, or label to edit with your own content. Adjust segment sizes proportionally to match your actual data distribution.
-
Recommended For
Executives, business strategists, operations managers, and marketing teams presenting at strategy meetings, business briefings, or organizational restructuring announcements. Particularly effective when simplifying complex operational structures into clear visual components.
-
Slide Structure
Two-slide set with identical pie chart layouts on different backgrounds. Slide 1 features a light gray background; Slide 2 uses dark navy. Each segment includes an icon button and label, with additional explanation text space on the right side of the chart.
Related Products
-

Pie Chart and Table Metrics – Market Share Analysis
#Market and Competitor Analysis #Financial Plans and Performance #Diagram
-

Two Pie Charts with Commentary – Market Share Analysis
#Market and Competitor Analysis #Graph #Market Status
-

Visualizing Market Share with Pie Chart – Successful Investment Planning
#Market and Competitor Analysis #Financial Plans and Performance #Graph
-

Market Targets and Status Chart – Visually Appealing Insights
#Market and Competitor Analysis #Graph #Market Status
