Visualizing Market and Risk Analysis with Pros and Cons Graphs
RJ0500028_26
- Last Update 06/14/2025
- File Size 1.2MB
- # of Slides 2
- File Format PPTX
- Slide Ratio 16:9
- Color
Keywords
- #Content-Based Slides
- #Design-Based Slides
- #Market and Competitor Analysis
- #Risk Management and Regulatory Compliance
- #Graph
- #Market Analysis
- # Risk Management Strategy
- #16:9
- #pros and cons comparison PowerPoint slide
- #market analysis presentation
- #risk management graph slide
- #competitive analysis PPT
- #two-panel comparison chart
About the Product
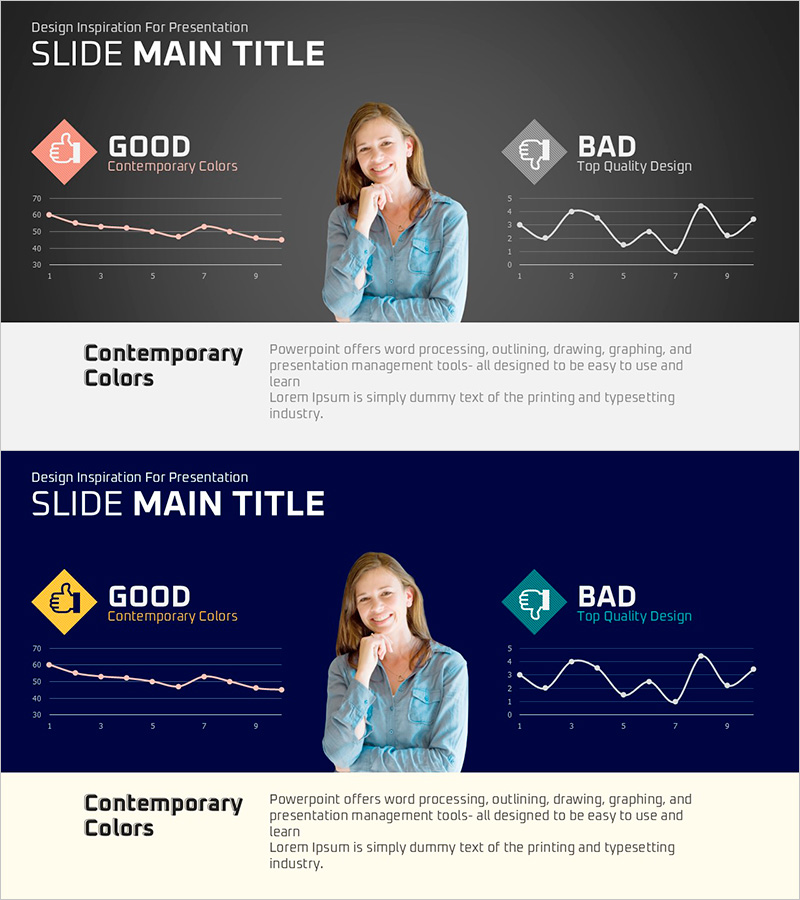
A two-slide PowerPoint presentation designed for market analysis and risk assessment using pros and cons comparison. The dark background features pink and gray accent icons with line charts positioned on the left showing upward trend data and on the right displaying volatility data, enabling simultaneous visualization of positive and negative indicators. With two text input areas and dedicated chart zones, this slide deck is ready to use for competitive analysis, market evaluation, and risk factor review presentations.
Usage Points
-
Main Usage
Present market conditions and risk factors side-by-side using pros and cons graphs to establish clear decision-making foundations. Optimized for competitive analysis, market share evaluation, and risk factor assessment presentations with data-driven insights.
-
How to Use
Enter upward trend data in the left 'positive indicators' section and volatility data in the right 'negative indicators' section. Modify titles and legends to adapt the slide for various presentation scenarios including market analysis, competitor comparison, and risk evaluation.
-
Recommended For
Recommended for executive and investor presentations, strategic planning meetings, market analysis reports, and risk management sessions. Particularly effective as a credible resource in business decision-making contexts requiring quantitative data visualization and comparative evaluation.
-
Slide Structure
Two-slide layout with title area at top, dual two-panel chart zones in center, and descriptive text area at bottom. Each chart functions as an independent line graph with clear data hierarchy, using icons and color coding to intuitively distinguish positive and negative factors.
Related Products
-

Geometric Pattern Wide PPT Radar Chart – Optimized for Market Analysis Visualization
#Market and Competitor Analysis #Graph #Market Status
-

Stacked Bar Chart by Country – Visualizing Market Trends
#Market and Competitor Analysis #Graph #Other
-

Year-over-year Comparison Analysis Bar Graph – Market Trends and Insights
#Market and Competitor Analysis #Graph #Market Analysis
-

Green & Gray Donut Chart Template – Perfect for Market Analysis
#Company Introduction #Market and Competitor Analysis #Graph
