3D Vertical Graph Market Status – Premium Template for Market Analysis
RJ0500028_14
- Last Update 06/14/2025
- File Size 0.4MB
- # of Slides 2
- File Format PPTX
- Slide Ratio 16:9
- Color
Keywords
About the Product
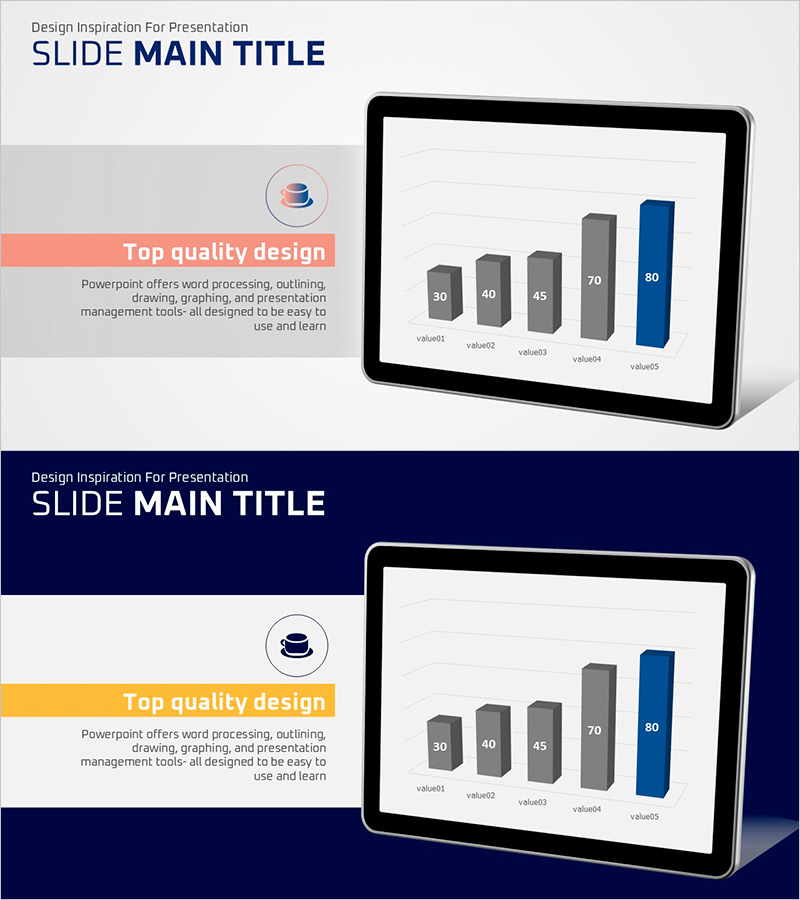
A 3D vertical bar chart PowerPoint slide designed for market analysis and data comparison presentations. This template visualizes five data points with clear numerical labels, using gray bars for standard values and a blue accent bar for the final item to highlight key metrics. The contrasting color scheme makes data hierarchy immediately apparent to your audience. Two slide layouts are included—one with a light gray background and another with a dark navy background—allowing you to adapt to different presentation environments. The 16:9 widescreen PPTX format ensures easy editing and compatibility with modern displays.
Usage Points
-
Main Usage
Visualize quantitative data across five categories such as market size, quarterly sales, regional performance, or competitive benchmarks. The 3D vertical bar format adds visual depth, while the accent color on the final bar emphasizes peak values or target metrics.
-
How to Use
Double-click on the data values and category labels to edit them directly. Choose the light background slide for bright presentation venues and the dark background slide for dimly lit rooms. Colors and numbers are fully customizable to match your data.
-
Recommended For
Executive reports, market analysis presentations, quarterly earnings calls, competitive analysis, investor pitches, and sales team meetings. Ideal for finance, marketing, and sales professionals who need to communicate quantitative insights with impact.
-
Slide Structure
Two-slide layout with Slide 1 featuring a light gray background with blue accent bars, and Slide 2 with a dark navy background with yellow accent bars. Each slide contains five 3D vertical bars (value01–value05), data labels, and icon elements in 16:9 aspect ratio.
Related Products
-

Usage Status and Trends by Application Graph - Horizontal & Vertical Bar Utilization
#Business Introduction #Market and Competitor Analysis #Graph
-

Business Trends and Market Status Visualization Slide Template – Ideal for Insights and Analysis
#Business Introduction #Market and Competitor Analysis #Graph
-

Battery Shape Vertical Bar Graph – Competitor Analysis
#Technical Approach #Market and Competitor Analysis #Graph
-

Triangular Bar Graph of Learning Metrics – Market and Competitor Analysis
#Market and Competitor Analysis #Graph #Market Status
