Regional Analysis Graphs – Visualizing Market Trends
RJ0500028_25
- Last Update 06/14/2025
- File Size 0.7MB
- # of Slides 2
- File Format PPTX
- Slide Ratio 16:9
- Color
Keywords
- #Content-Based Slides
- #Design-Based Slides
- #Market and Competitor Analysis
- #Graph
- #Other
- #Market Analysis
- #Target Market
- #Horizontal Bar
- #Segmented Horizontal Bar
- #Map
- #16:9
- #regional analysis map PowerPoint
- #world map slide template
- #horizontal bar chart PPT
- #market trend visualization
- #geographic data comparison slides
- #country-level analysis presentation
- #Europe map PowerPoint template
About the Product
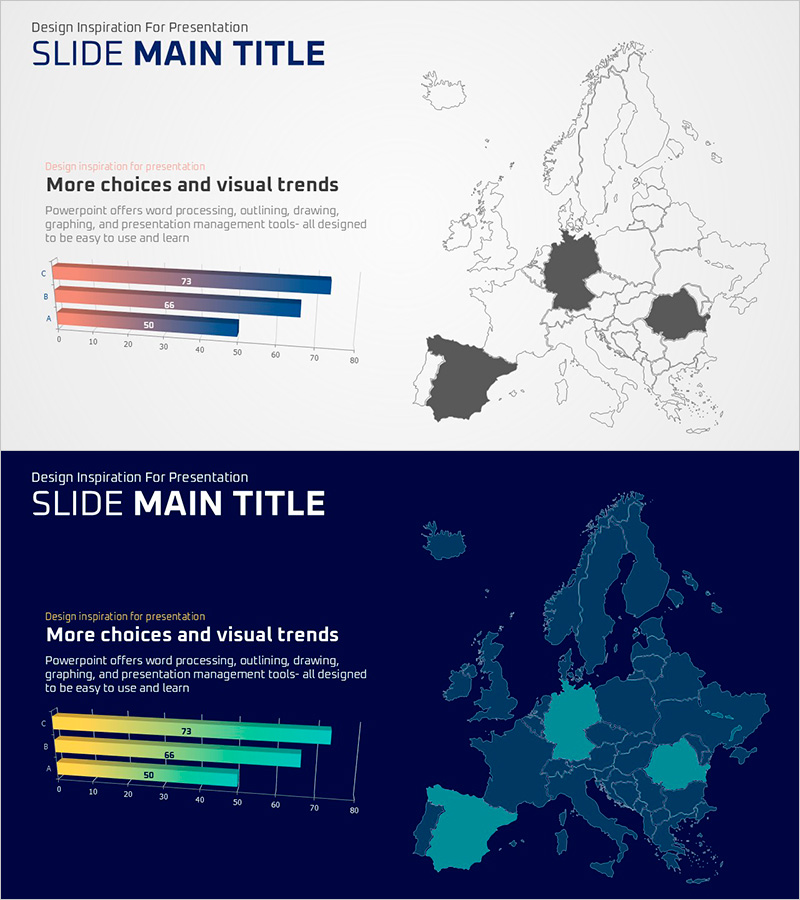
A PowerPoint slide set visualizing European regional market trends with world map and horizontal bar charts. This template features two distinct design layouts: a light gray background version and a dark navy background version, each with gradient-colored bar charts to clearly differentiate data series. The light version uses red-orange-blue gradient bars, while the dark version employs yellow-green-teal gradient bars for enhanced contrast. Each slide includes a Europe map with country-level data highlighting and corresponding horizontal bar graphs for numerical comparison. Ideal for regional analysis, market research, competitive benchmarking, and business presentations requiring geographic and quantitative data visualization.
Usage Points
-
Main Usage
Simultaneously display regional and country-level market size, sales volume, and market share data through integrated map and chart visualization. Enables geographic distribution and numerical comparison at a glance. Ideal for executive reports, marketing strategy presentations, and investor pitch decks to communicate global market positioning persuasively.
-
How to Use
Slide 1 features a light gray background with Europe map and horizontal bar chart, suitable for bright presentation environments. Slide 2 uses dark navy background for high contrast in projector settings. Edit the map highlighting regions and chart data series to input your actual analysis targets and numerical values. Both slides support 16:9 widescreen format.
-
Recommended For
Executive and C-level business reports, marketing team market analysis presentations, sales team regional performance sharing, consulting firm market research reports, investor relations materials, international business strategy meetings, and geographic market expansion planning sessions.
-
Slide Structure
2-slide set. Slide 1: Light gray background + Europe world map with 3-4 country-level highlights + horizontal bar chart with 3 data series in red-orange-blue gradient. Slide 2: Dark navy background + Europe world map with 3-4 country-level highlights + horizontal bar chart with 3 data series in yellow-green-teal gradient. Both slides in 16:9 widescreen format with editable elements.
Related Products
-

Target Market Analysis Data Table - Market Growth Statistics
#Market and Competitor Analysis #Graph #Other
-

Asia Target Market Analysis Graph – Tremendous Visual Appeal
#Market and Competitor Analysis #Graph #Other
-

Target Country Analysis Chart – Data Visualization for Market Analysis
#Market and Competitor Analysis #Graph #Other
-

Gauge Charts by Region – Market Analysis and Competitiveness
#Market and Competitor Analysis #Graph #Other
