Progress Doughnut Graphs for Visualizing Key Achievements – Essential for Project Management
RJ0500028_7
- Last Update 06/14/2025
- File Size 0.2MB
- # of Slides 2
- File Format PPTX
- Slide Ratio 16:9
- Color
Keywords
- #Content-Based Slides
- #Design-Based Slides
- #Company Introduction
- #Product/Service Introduction
- #Diagram
- #Graph
- #Key Achievements
- #Development Status
- #Cluster
- #Circles
- #Closed Cluster Diagram
- #16:9
- #doughnut chart PowerPoint
- #progress chart template
- #4-item ratio slide
- #circular graph presentation
- #performance visualization PPT
About the Product
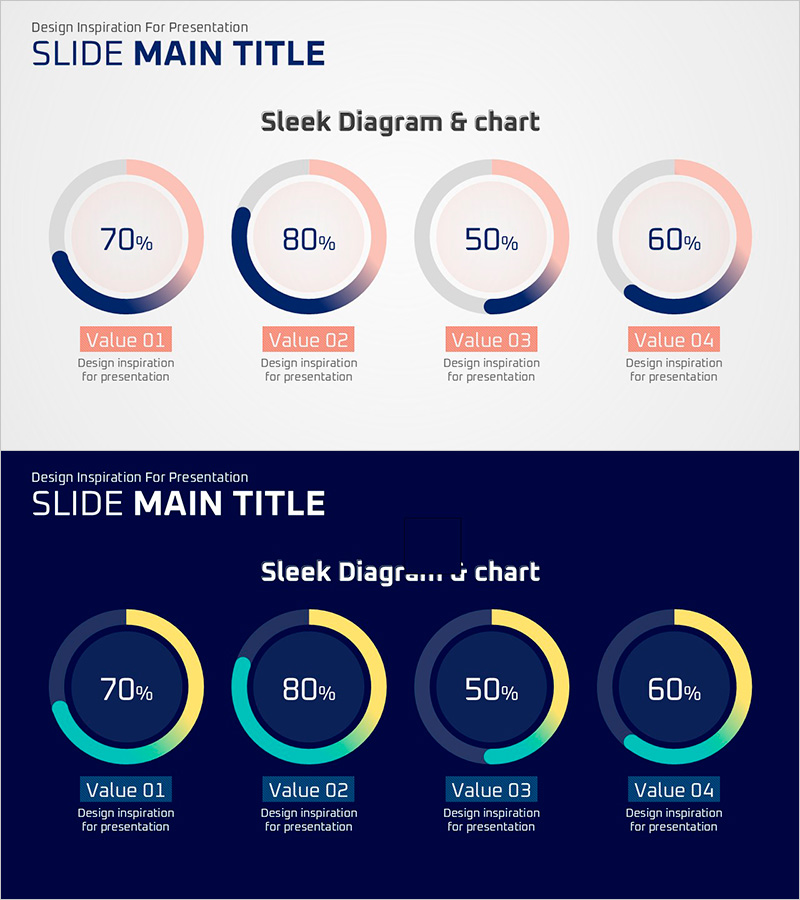
A professional doughnut chart PowerPoint slide designed for project management and performance reporting. This presentation template features four progress indicators displayed simultaneously using navy blue and pink-cyan dual-tone color schemes, with percentage values clearly centered in each doughnut. Two layout variations are provided: a light background version for standard presentations and a dark navy background for evening sessions or premium-toned decks. Instantly applicable for visualizing key achievements, development status, and project completion rates in your slides.
Usage Points
-
Main Usage
Compare and analyze four metrics simultaneously—such as project progress rates, key achievements, development status, and goal completion percentages. The centered percentage display supports data-driven decision-making, while the doughnut shape intuitively conveys proportional relationships among items.
-
How to Use
Replace the sample percentages (70%, 80%, 50%, 60%) with your actual data and update the labels (Value 01–04) to reflect project names or achievement categories. Use the light background for standard presentations and the dark background for evening sessions or sophisticated corporate decks.
-
Recommended For
Project managers, development team leads, marketing professionals, and executives preparing quarterly or annual performance reports, project status updates, and goal achievement analyses. Ideal for company overviews, business reports, and performance presentation materials.
-
Slide Structure
Slide 1: Light gray background with four navy-pink doughnut charts arranged horizontally. Slide 2: Dark navy background with the same four doughnuts in cyan-yellow tones. Each doughnut displays a centered percentage value with labels and description text below. 16:9 widescreen format, 2-slide set.
Related Products
-

Visualizing Key Achievements with Donut Chart Slide – Company and Product/Service Introduction
#Company Introduction #Product/Service Introduction #Diagram
-

Donut Diagram Visualizing Technology Development Status
#Company Introduction #Product/Service Introduction #Diagram
-

Ability Donut Chart for Performance Visualization – Emphasizing Key Achievements
#Company Introduction #Product/Service Introduction #Graph
-

Visualizing Simple Design Trend with Donut Chart PPT
#Company Introduction #Product/Service Introduction #Graph
