3D Area Charts and Descriptions – Suitable for Market and Competitor Analysis
RJ0500028_23
- Last Update 06/14/2025
- File Size 0.2MB
- # of Slides 2
- File Format PPTX
- Slide Ratio 16:9
- Color
Keywords
About the Product
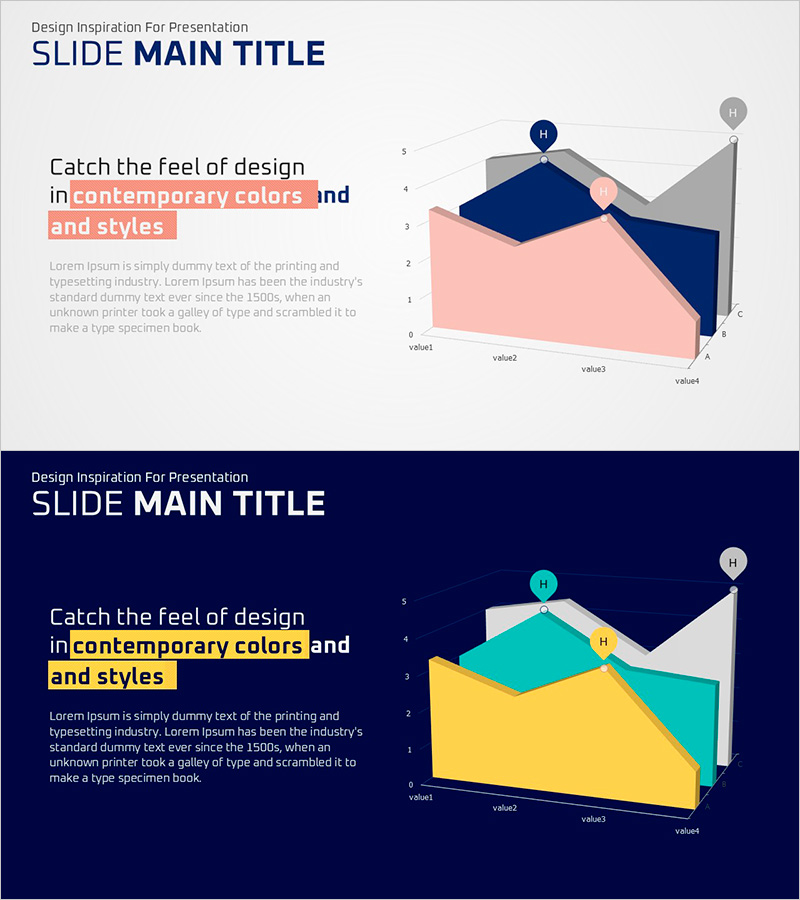
A 3D area chart PowerPoint slide optimized for market and competitor analysis presentations. The light gray background with navy and pink dual-tone colors enables intuitive data comparison and visualization. The left text area explains analysis findings while the right 3D chart visualizes market share, competitive positioning, and trend changes. The 2-slide set includes both light and dark background versions, allowing you to match your presentation environment and corporate branding. Fully editable in PowerPoint format—easily modify figures, labels, and data series to fit your analysis.
Usage Points
-
Main Usage
Visualize market conditions and competitive positioning using 3D area charts. This slide enables clear comparison of market share, competitive strengths, and market trend changes at a glance. Supports data-driven decision-making in investor presentations, executive reports, and strategy meetings.
-
How to Use
Enter analysis title and key insights in the left text box, then modify chart values and legend labels with your actual data. Use the light background slide for standard meeting rooms and the dark background for dimly lit venues or premium presentation atmospheres. Customize chart colors and text highlights to match your corporate brand identity.
-
Recommended For
Recommended for marketing managers, strategy planning teams, sales executives, and investor relations presentations. Ideal for new business entry reviews, competitive strategy development, market share reporting, and quarterly performance analysis—any presentation requiring data-driven decision support.
-
Slide Structure
2-slide set with each slide featuring a left text input area (1 title, 1 body section) and right 3D area chart (4 data series, 4 axis labels). Includes both light and dark background versions for flexible presentation environment adaptation.
Related Products
-

Analysis of Key Competitor Positioning to Enhance Market Competitiveness
#Market and Competitor Analysis #Marketing Plan and Strategy #Diagram
-

Graph Comparing Transportation Methods – Market Overview Analysis
#Market and Competitor Analysis #Graph #Other
-

Competitor Analysis PC Mockup Graph – Market Trends and Insights
#Market and Competitor Analysis #Graph #Other
-

Competitive Comparison Area Diagram – Visualizing Market Advantage
#Market and Competitor Analysis #Graph #Other
