3D Triangle Graph for Market Analysis – Strategic Insights
RJ0500028_28
- Last Update 06/14/2025
- File Size 0.2MB
- # of Slides 2
- File Format PPTX
- Slide Ratio 16:9
- Color
Keywords
- #Content-Based Slides
- #Design-Based Slides
- #Business Vision and Strategy
- #Market and Competitor Analysis
- #Diagram
- #Graph
- #Business Strategy
- #Competitor Analysis
- #Cluster
- #Column
- #Closed Cluster Diagram
- #Grouped Column
- #16:9
- #triangle chart PowerPoint
- #grouped chart template
- #market analysis slide
- #data comparison graph
- #business strategy presentation
About the Product
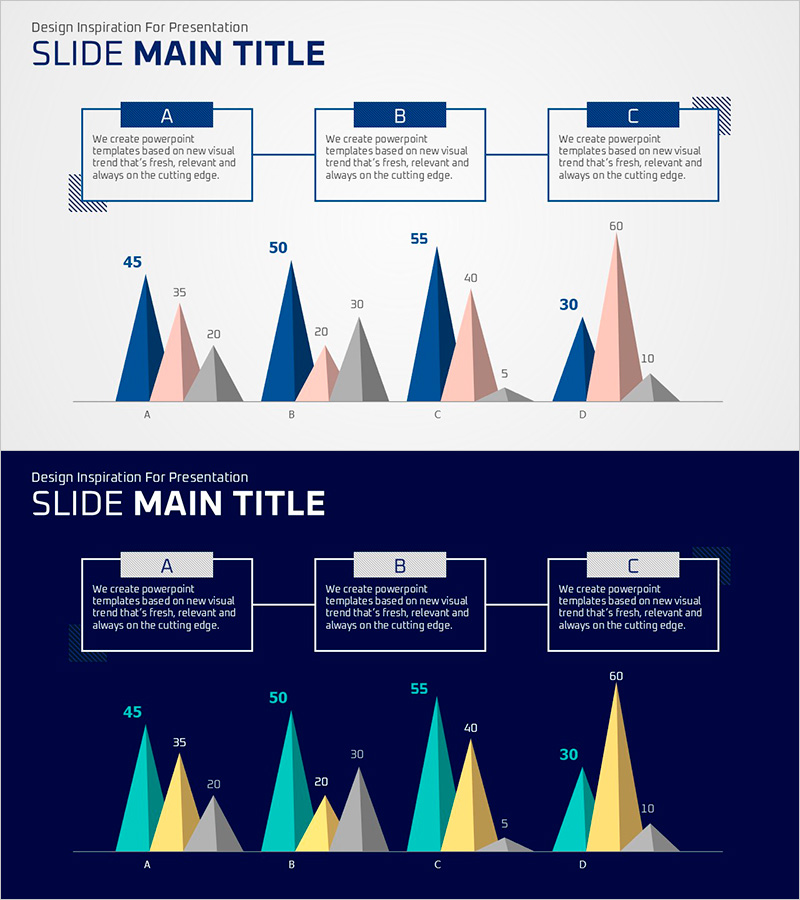
A grouped triangle chart PowerPoint slide featuring three data series represented by triangle shapes in dark blue, pink, and gray. The slide displays comparative data across four items (A, B, C, D) with labeled values, making it ideal for market analysis, competitive benchmarking, and business strategy presentations. The upper section includes three process or strategy element boxes (A, B, C) connected by lines for contextual explanation. Two versions are provided: light background for bright meeting rooms and online presentations, and dark background for premium visual impact in low-light environments. All text, numbers, and colors are fully editable for immediate use.
Usage Points
-
Main Usage
Visualizes three data series using triangle shapes to enable clear comparative analysis across multiple items. Effectively displays market size, competitor performance, or departmental revenue across different time periods or business units simultaneously.
-
How to Use
Enter analysis stage names or strategy element labels in the upper A, B, C text boxes. Edit the triangle values to reflect your actual data. Use the light background version for bright conference rooms and online meetings, and the dark background version for premium presentation environments or low-light settings.
-
Recommended For
Recommended for executive presentations, quarterly and annual performance reviews, strategic planning meetings, investor pitch decks, and consulting reports. Ideal for teams in management, strategy, marketing, and sales who need to present quantitative multi-series comparisons.
-
Slide Structure
Slide 1 (light background): Three connected process boxes (A, B, C) at top with connecting lines, followed by grouped triangle chart with four items (A, B, C, D) showing three data series each with value labels. Slide 2 (dark background): Identical layout with dark blue background and cyan, yellow, and gray triangle shapes.
Related Products
-

Competitor Comparison Analysis Bar Graph – Data Visualization for Market Analysis
#Market and Competitor Analysis #Diagram #Graph
-

Competitive Companies Comparison Graph – A Powerful Tool for Market Analysis
#Market and Competitor Analysis #Diagram #Graph
-

Clustered Vertical Bar Graph Slide – Visualizing Market Analysis
#Market and Competitor Analysis #Diagram #Graph
-

Preference Analysis Graph by Plastic Surgery Field
#Market and Competitor Analysis #Marketing Plan and Strategy #Diagram
