Detailed Customer Analysis by Region – Data Visualization Slide
RJ0500028_21
- Last Update 06/14/2025
- File Size 0.3MB
- # of Slides 2
- File Format PPTX
- Slide Ratio 16:9
- Color
Keywords
About the Product
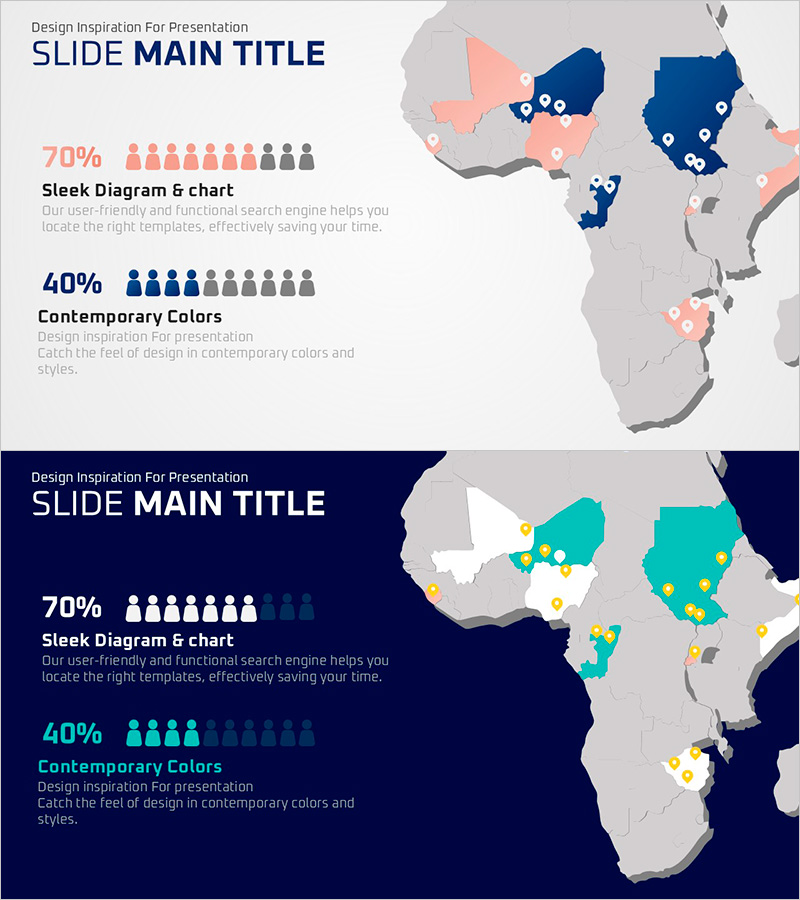
A PowerPoint slide that visualizes regional customer distribution and market share across a geographic map. The design features an Africa map background with color-coded regions in navy blue, coral pink, and turquoise to represent data progression. The left side displays percentage metrics paired with icon-based charts showing customer counts. Two layout versions are provided: a light background variant and a dark navy background variant, allowing flexibility in presentation styling. Ideal for business presentations, market analysis reports, and regional performance reviews.
Usage Points
-
Main Usage
Presents regional customer distribution, market penetration rates, and geographic performance metrics in an intuitive map-based format. Enables stakeholders to quickly identify regional strengths, market gaps, and expansion opportunities during investor pitches, market analysis reports, and strategic planning sessions.
-
How to Use
Input actual regional data into the map regions and update the percentage values and icon charts on the left panel. Choose between the light or dark background version based on your presentation's overall design theme to maintain visual consistency throughout the deck.
-
Recommended For
Marketing managers, sales directors, business analysts, and executives presenting regional performance data. Suitable for new market entry strategies, regional revenue reports, customer acquisition plans, and geographic expansion discussions.
-
Slide Structure
Two-slide layout with each slide divided into map area (right 60%) and data input area (left 40%). The left panel contains two percentage metrics with corresponding icon charts (10-icon scale) enabling side-by-side regional comparison and performance tracking.
Related Products
-

People Silhouette and Comparison Graph – Data Visualization for Customer Analysis
#Market and Competitor Analysis #Graph #Other
-

Child Silhouette and Figures – Visualizing Customer Insights
#Product/Service Introduction #Market and Competitor Analysis #Graph
-

User Gender Ratio Analysis Diagram
#Market and Competitor Analysis #Graph #Other
-

Learning Content Customer Analysis Slide - Intuitive Graphs and Data Visualization
#Market and Competitor Analysis #Marketing Plan and Strategy #Graph
