Pink Navy Curved Line Graph and Description
RJ0500028_11
- Last Update 06/14/2025
- File Size 0.2MB
- # of Slides 2
- File Format PPTX
- Slide Ratio 16:9
- Color
Keywords
About the Product
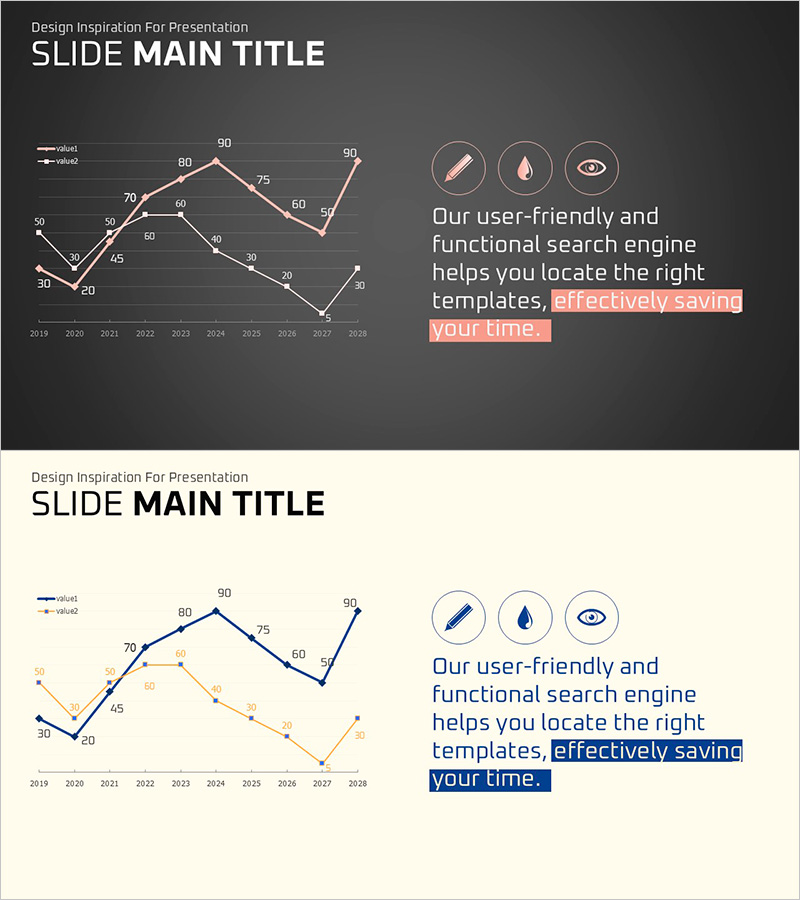
A professional line chart PowerPoint slide displaying two data series across a 10-year timeline (2019–2028) with pink and navy line colors. The dark gray background provides strong contrast, while data point labels show exact values for precise comparison. The right side features three circular icons and a text description area, making it ready for immediate use in business presentations. This slide template is ideal for visualizing business performance trends, market analysis, competitive benchmarking, and year-over-year growth comparisons in executive reports and investor pitches.
Usage Points
-
Main Usage
Visualizes changes in two or more data series over time, enabling clear trend comparison and analysis. Ideal for displaying business performance trajectories, market share evolution, competitive performance metrics, revenue trends, and customer growth patterns in professional presentations.
-
How to Use
Present the two data lines on the dark gray background, emphasizing key inflection points and trends. Use the right-side icon area to highlight critical insights or conclusions drawn from the data. Walk through year-by-year changes by referencing the labeled data points to support your narrative.
-
Recommended For
Business strategy presentations, market analysis reports, investor relations meetings, quarterly performance reviews, competitive analysis decks, and executive briefings. Recommended for finance professionals, marketing strategists, and business leaders presenting data-driven insights.
-
Slide Structure
Two-series line chart (pink and navy) / 10 data points spanning 2019–2028 / labeled values at each point / left-side legend / right-side icon cluster (3 icons: pen, water drop, eye) with text description area / 16:9 aspect ratio / 2-slide set
Related Products
-

Car Model Revenue Comparison Analysis Graph – Insights into Market Trends
#Business Introduction #Market and Competitor Analysis #Diagram
-

Simple Car Wide Presentation Line Chart – Visualizing Business Growth
#Business Introduction #Market and Competitor Analysis #Graph
-

Purple Orange Curved Line Chart – Visualizing Competitive Edge
#Market and Competitor Analysis #Graph #Competitor Analysis
-

Garden Management Curve Graph
#Market and Competitor Analysis #Financial Plans and Performance #Graph
