3D Horizontal Segmentation Graph – Market Trend Analysis
RJ0500028_17
- Last Update 06/14/2025
- File Size 0.2MB
- # of Slides 2
- File Format PPTX
- Slide Ratio 16:9
- Color
Keywords
- #Content-Based Slides
- #Design-Based Slides
- #Market and Competitor Analysis
- #Graph
- #Industry Trends
- #Horizontal Bar
- #Segmented Horizontal Bar
- #16:9
- #horizontal segmentation chart PowerPoint
- #market analysis slide template
- #3-series bar chart
- #year-over-year comparison
- #how to create segmentation chart in PowerPoint
About the Product
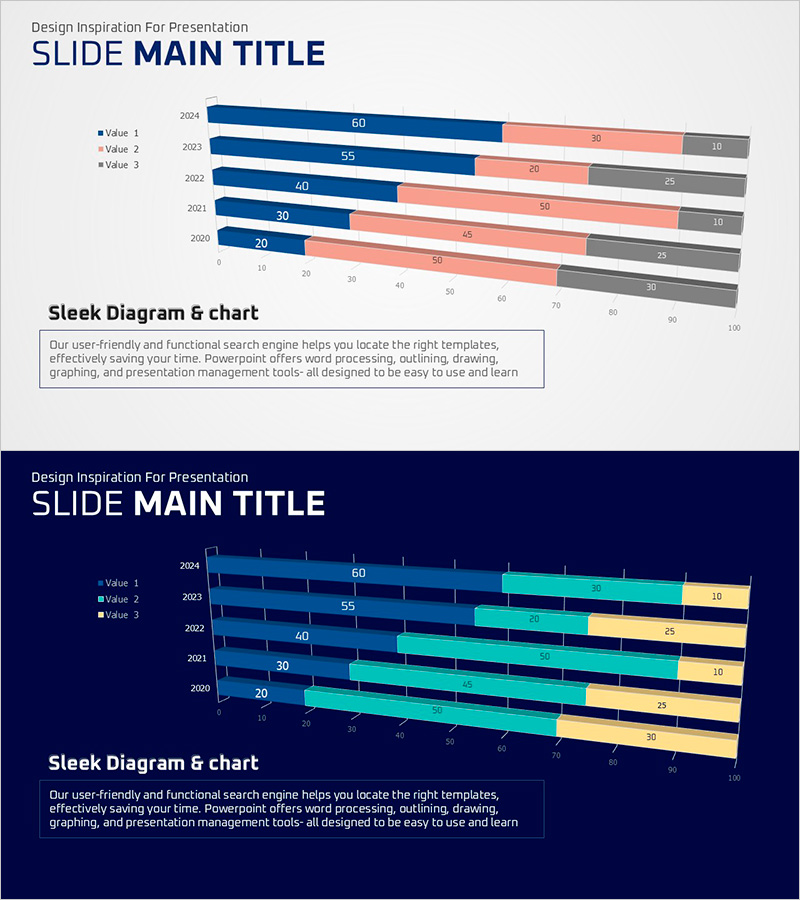
A horizontal segmentation chart PowerPoint slide visualizing 5-year market trends (2020–2024) across three data series (Value 1, Value 2, Value 3). The design uses a three-color palette—navy blue, coral salmon, and gray—to simultaneously display numerical comparisons and compositional ratios for each year. Ideal for business presentations, annual reports, and strategic planning documents, this slide template enables quick data visualization of market share, sales performance, departmental results, and customer satisfaction metrics. Fully editable to accommodate your own data.
Usage Points
-
Main Usage
Simultaneously visualizes year-over-year numerical comparisons and compositional ratios across three data series. Effectively communicates market share, sales performance, departmental achievements, and customer satisfaction data in a single, comprehensive view.
-
How to Use
Insert into the market analysis or business performance section of presentations to explain annual trends and item-by-item comparisons. Use in reports, strategic plans, and investment materials to present data-driven decision-making evidence. Directly edit the values to replace with your own data for immediate deployment.
-
Recommended For
Marketing, sales, and business planning professionals presenting market analysis results to executives and clients. Suitable for financial reports, quarterly performance reviews, business plans, and strategic management meetings where multi-series data comparison is essential.
-
Slide Structure
Two-slide set: first slide features a light gray background with three-color horizontal bar chart; second slide presents the same chart structure on a dark navy background. Each slide displays 5 years (rows) × 3 data series (colors), totaling 15 data points with numerical labels positioned above each bar segment.
Related Products
-

Navy-Orange 100% Stacked Chart
#Market and Competitor Analysis #Graph #Industry Trends
-

Eco-friendly Business Market Share Segmentation Horizontal Bar Chart
#Market and Competitor Analysis #Graph #Industry Trends
-

Analyzing Flower Horizontal Segmentation Charts – Understanding Market Trends
#Market and Competitor Analysis #Graph #Industry Trends
-

Paint Piano and Segmentation Bar Graph – Market Trend Analysis
#Market and Competitor Analysis #Graph #Market Analysis
