Pink Navy Map Analysis Slide – Operational Planning and Market Analysis
RJ0500028_10
- Last Update 06/14/2025
- File Size 0.6MB
- # of Slides 2
- File Format PPTX
- Slide Ratio 16:9
- Color
Keywords
- #Content-Based Slides
- #Design-Based Slides
- #Operational Plan
- #Market and Competitor Analysis
- #Text Box
- #Other
- #Organizational Structure and Staffing Plan
- #Market Analysis
- #Map
- #16:9
- #map analysis PowerPoint slide
- #global map presentation
- #regional data visualization
- #market analysis map slide
- #how to create a world map chart in PowerPoint
About the Product
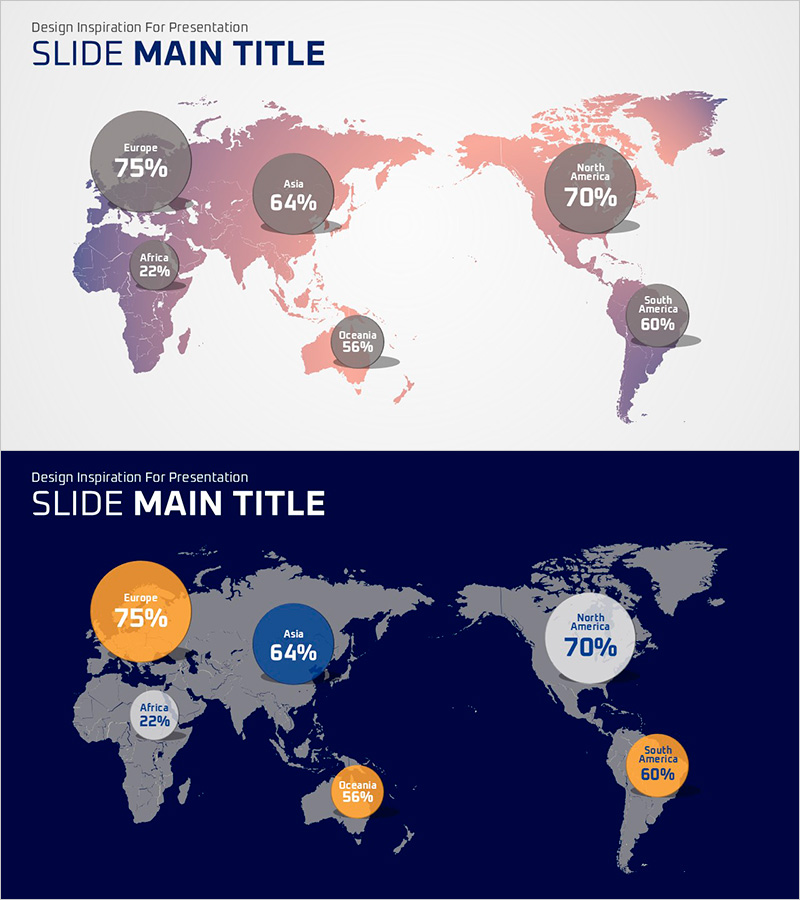
A world map-based PowerPoint slide designed for global market analysis and regional performance comparison. The slide combines a geographic map with circular percentage charts in pink and navy tones, enabling clear visualization of data across six continents: Europe, Asia, North America, South America, Africa, and Oceania. The layout effectively presents multiple regional metrics simultaneously, making it ideal for business reports, market analysis presentations, and investor meetings. Two design variations are included—a light background version for printed documents and a dark background version for projection presentations, allowing flexible adaptation to different presentation environments.
Usage Points
-
Main Usage
This slide visualizes global market conditions, regional performance comparisons, and competitive analysis results using an interactive map format. By combining circular charts with geographic representation, it enables simultaneous display of numerical data and geographic location, providing high readability for international business reports, market analysis presentations, and investor relations meetings.
-
How to Use
Enter actual performance metrics into each regional circular chart and modify region names and legends as needed. The light background version suits printed documents and bright presentation environments, while the dark background version is ideal for projector presentations and online meetings. All colors and chart values are fully editable to match your data.
-
Recommended For
International business managers, marketing strategy teams, executive reporting specialists, management consulting analysts, and investor relations professionals who need to communicate global market conditions, regional performance metrics, and competitive positioning with visual impact and clarity.
-
Slide Structure
Two-slide set with each slide featuring a world map background and six regional circular charts (Europe, Asia, North America, South America, Africa, Oceania). The layout includes seven editable fields: six regional data entry areas with percentage values and one title area. Two background options—light tone and dark tone—allow selection based on document style and presentation context.
Related Products
-

Cosmetics Market Analysis Slide – Market Trends and Competitiveness
#Operational Plan #Market and Competitor Analysis #Text Box
-

Lunar Cycle Diagram – Visualizing Business Strategy
#Business Strategy #Operational Plan #Diagram
-

Target Country Year-by-Year Analysis Chart – Data Visualization for Market Analysis
#Market and Competitor Analysis #Graph #Other
-

Carbon Neutral World Map for Overseas Market Analysis – Guidelines for Greenhouse Gas Reduction
#Market and Competitor Analysis #Other #Market Analysis
