Gradient Display Calendar – Stylish & Practical
RJ0500028_29
- Last Update 06/14/2025
- File Size 0.2MB
- # of Slides 2
- File Format PPTX
- Slide Ratio 16:9
- Color
Keywords
About the Product
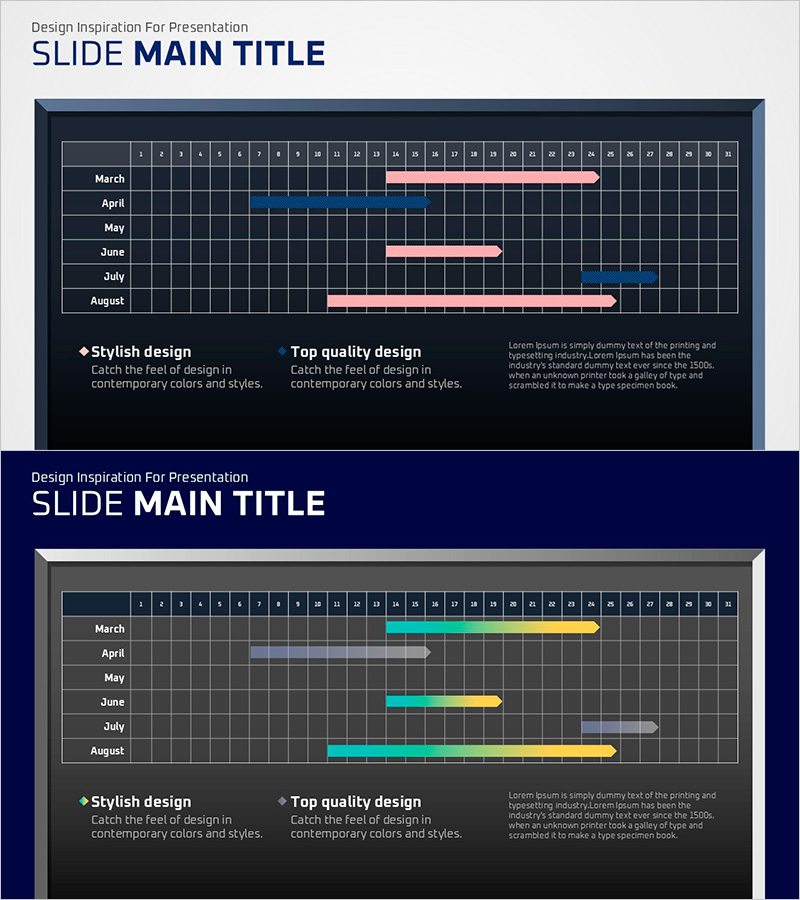
A professional Gantt chart PowerPoint slide for project timeline visualization and schedule management. Displays a 6-month period from March to August with monthly task bars in gradient pink and blue colors, clearly showing start dates, end dates, and task duration. The dark background with grid structure ensures excellent data readability and precise date tracking. Two-slide set enables flexible project schedule representation across different scenarios. Formatted in 16:9 widescreen for modern presentation environments. Ideal for communicating project milestones, parallel workflows, and sequential task dependencies in business presentations, proposals, and status reports.
Usage Points
-
Main Usage
Visualize project schedules and track progress using Gantt chart format. Gradient-colored bars represent task duration across months, enabling quick identification of overlapping tasks, parallel workflows, and sequential dependencies. Clearly communicates project milestones and overall timeline to stakeholders.
-
How to Use
Insert into business plans, project proposals, and progress reports in the timeline section. Customize bar lengths and colors to match actual project durations. Monthly labels and grid lines enable precise date comparisons and schedule adjustments. Supports multi-project visualization by duplicating slides.
-
Recommended For
Project managers, planning teams, and marketing departments presenting project status updates. Suitable for investment pitch decks explaining business timelines, business plan presentations with milestone tracking, and quarterly goal-setting sessions.
-
Slide Structure
Two-slide layout. First slide features three pink gradient bars representing March-May tasks. Second slide displays three gradient bars in blue, cyan, and yellow tones for June-August. Each slide includes monthly labels, date grid (1-31), and task duration bars with clear start and end points.
Related Products
-

VR Market Analysis Bar Graph
#Market and Competitor Analysis #Diagram #Graph
-

Construction Work Flow System – Efficient Operation Planning and Risk Management
#Operational Plan #Diagram #Business Processes
-

Fruit Introduction Diagram Slide – Fresh Business Potential
#Product/Service Introduction #Diagram #Product/Service Introduction
-

Interior Tips for Seniors – Design and Creativity
#Product/Service Introduction #Business Introduction #Diagram
